"Overbought But Not Broken", Sort Of
"Overbought But Not Broken" was the title of my Intermarket Analysis post for CLUB/EDGE clients last week with updated charts (23 of them) posted Saturday warning:
"charts are intonating a breakdown, but they just haven’t confirmed with price, yet."
Well, NYSE has triggered on queue - after warning Monday in my live trading room that the selling under the market had started, but the market didn't know it yet.
Tuesday morning Live Trading Room's Summary posted:
SPX still stuck in a shake and bake market between 4780 and 4749, above 4780 we have 4800,4820
But under the surface internals are rolling over worth being cautious with a potential sell that may come on Wednesday
IWM short PTs: 187.77
SPX short PT: 4730/10
DXY above 102.82 means on way to 103.50 this week
What else is working:
TSLA tagged our 213 target and bounced, now we have lower targets at 209,205
JPM chase $173 short on green/red Friday print made it to daily gap fill at 165.28 before wee bounce.
XLF resistance/stop still 38
BA hit our 213.4 target and overshot to 208, now we chased it lower to 205 next is 200 then 197
ROKU short made it to daily gap fill + 100D at 84.51
SQ reversal at 78 with wkly gap down below 75.77 is now at 55D at 64.55.
SNAP also parabolic reversal on wkly with 15.38 + 14.47 still in play below 16.49
ENPH fell into 108 short PT from 132
XLE still short + about to break trendline on way to 80
Risks are rising in Taiwan post elections this weekend, plus Iran strike near US Consulate as Middle East escalation continues.
Watch USDJPY + USDCNH rising as a tell for risk off in equities.
Join our live trading room and get the summaries posted in #Chase & #Swing & #trading-room-notes from me and my live trading room moderators.
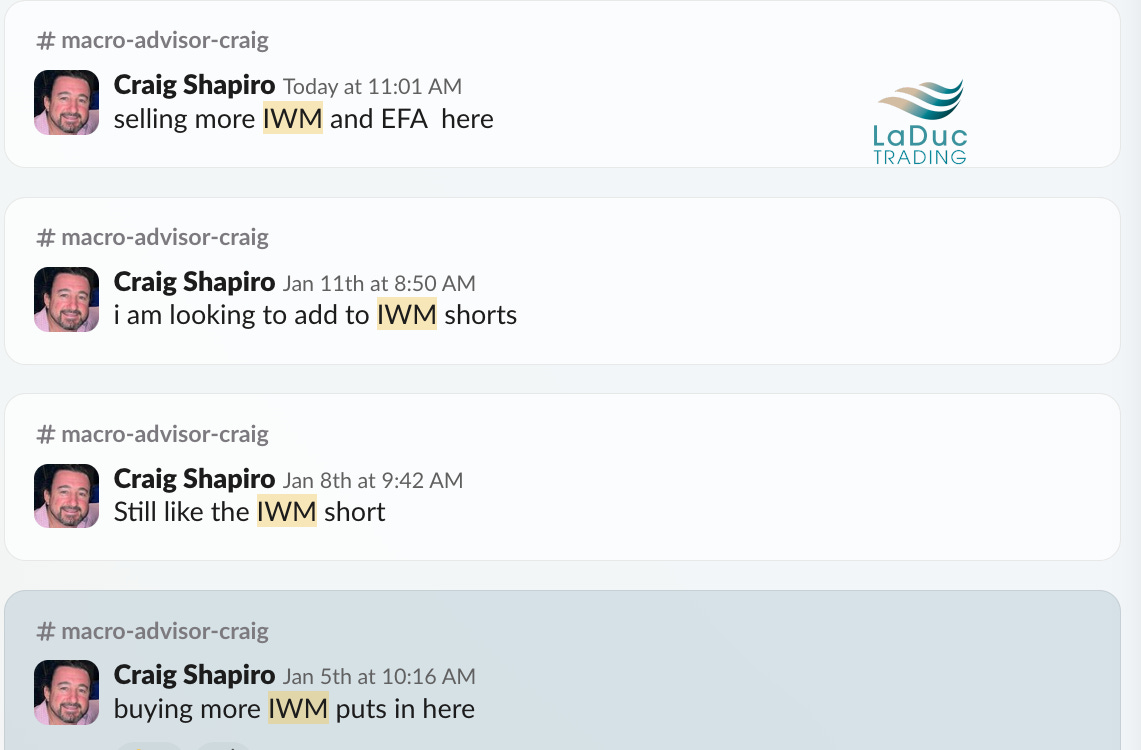
Tiffany, our gamma options contributor in #tiffs-gamma-flow nailed the recent IWM weakness as did Craig #macro-advisor-craig, who was positioned short the Wednesday before the new year even started!
And Yes, Russell Broke Down
Here is the Before (Fri) and After (Today/Wed) for NYSE Composite.
This doesn't even show the selling or breadth breakdown. If you were in my trading room this morning, you know how shocked I was with the size of the breakdown.
NYSE has rolled over hard, but the market doesn't know it yet.
I also highlighted how "Positioning is Overbought" - from NAAIM, to Retail Flows, CTAs and Nasdaq Net Specs.
This doesn't mean they will sell, but they will de-risk on sight of first trigger: Government Shutdown drama, Earnings, FOMC February 1st or the really big event of Treasury’s Quarterly Refunding Announcement Jan 29th.
Even Before Waller & Retail Sales & Red Sea Conflict
US dollar and 10Y yields have been moving higher.
My Macro price targets from Jan 3rd have helped my client recommended sector rotation/sector shorts in IWM, TLT, FXY, GDX, XME, XLE short theme.
"US 10Y yields MOVE violently intraday next few weeks into 4.1/4.2% before getting rejected, and reversing lower.
DXY bounces off $100 into $104/105 before getting rejected, and reversing lower.
USDJPY moves into 145/146 before getting rejected, and reversing lower. "
Today: 4.11% 10Y, 103.50 DXY, and 148 SUDJPY with potential for 150 by Friday.
Basically, small caps already smelled it and started selling off under the surface last Tuesday.
Back to Waller.
Chris Waller is a voting member who spoke Tuesday to likely pullback the 6-7 rate cut expectations priced into the market (175 basis points) by the end of 2024.
Fed is projecting only 3 cuts this year.
'I believe the FOMC will be able to lower the target range for the federal funds rate this year. This view is consistent with the FOMC's economic projections in December, in which the median projection was three 25-basis-point cuts in 2024. Clearly, the timing of cuts and the actual number of cuts in 2024 will depend on the incoming data.'
PCE is up next Friday the 26th, before the Feb 1st FOMC announcement, Waller sees it around the Fed's target of 2% (on a 3-month and 6-month annualized basis), but wants to make sure it's not transitory.
But with the Fed Funds Rate over 5.3%, the real rate is too rich (300 basis points higher than inflation).
So the Fed is currently in a technically restrictive stance which could put pressure on the economy and trigger deflation.
A parallel could be drawn between 2007 rate cut not being enough contributing to the 2008 financial crisis.
Additional incentive: if they cut now, they will be in a better position to raise later should/when inflation resurgence risk resurfaces.
Fed Cuts Juice Stocks Not Economy
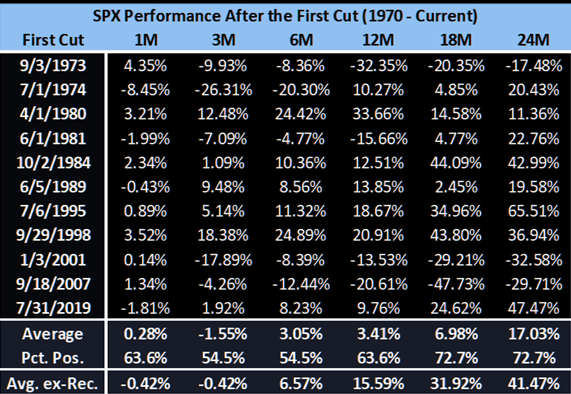
Speaking of Fed rate cuts, Jeffries is out with a call that cuts juice stocks but not GDP.
According to Jeffries,
"We found that while cuts can help when there is a recession, getting cuts without one has sent returns nearly parabolic. 12mo returns average 16%, while 24mo returns average whopping 42%. That said, whether there is a recession or not, returns tend to be a little squishy over the first 3mo after the initial cut, with SPX performance negative on average in both scenarios. As a result, the longer the Fed waits to cut (if they are going to), the greater the chance of a slump later this year."
Also noteworthy:
"cuts don’t seem to necessarily juice the economy up, especially if it is in the process of slowing down." (Jefferies)
Trend Long Update: Uranium
Congrats Uranium Longs! Uranium 16-Year High. Highest price since November 2007.
This is a core position recommended to clients since DEC 2020, so they only need to check our client slack workspace for the updates I posted last week. In part:
The world’s largest and lowest-cost producer of uranium, Kazatomprom, announced that it “expects adjustments to its 2024 production plans” due to supply chain problems and construction delays.
I also posted a warning to take care as an approaching parabola can trigger hard mean reversals. It’s a LONG TERM trend so profit taking is part of the dance.
Watch that 10W EMA as “PROTECT TO” level.
Quants & Options Market Hedge
@GammaLab weighs in:
Gamma will get cut in half through Friday, which lays the groundwork for a vol up scenario.
SPX put volume printed the highest of the year (chart below), as the index dropped back below the critical gamma flip level at 4,750 on a jump in vol to 14.8% (now highest since Nov 14).
According to our model equity CTAs are not selling yet, partly because bonds are being sold, but another 0.5 SDEV down move will certainly trigger a wave of selling.
Nomura is out warning about upside risk post Yellen but also downside risk should 4750 not hold.
@VolSignals explains:
Dealer positioning in SPX is worsening as we head into Jan OPEX-
and dealer positioning in VIX Calls is notably strained (1%-ile, per Nomura's McElligott = *very* short).Supportive positioning is evaporating / replaced with increasingly negative gamma.
So there you have it: risk to the upside AND downside still in play.


