
Week of July 7th, 2025 Live Trading Room Market Recap & Trades
NVDA, BTCUSD, ETHUSD, SPX, UBER, SLV, KSS, TGT, BIDU, JBHT, BTU, CLF, MSOS, UUUU, CSX, RCAT, ACHR, AG, BA, FCX, UFO, COPX, XME, NEM, AMD, NXPI, STM, ON, DELL, QCOM, MRVL, FLR, VLO, MPC, PBF, IWM, UUP

No Signs Of Weakness, Yet
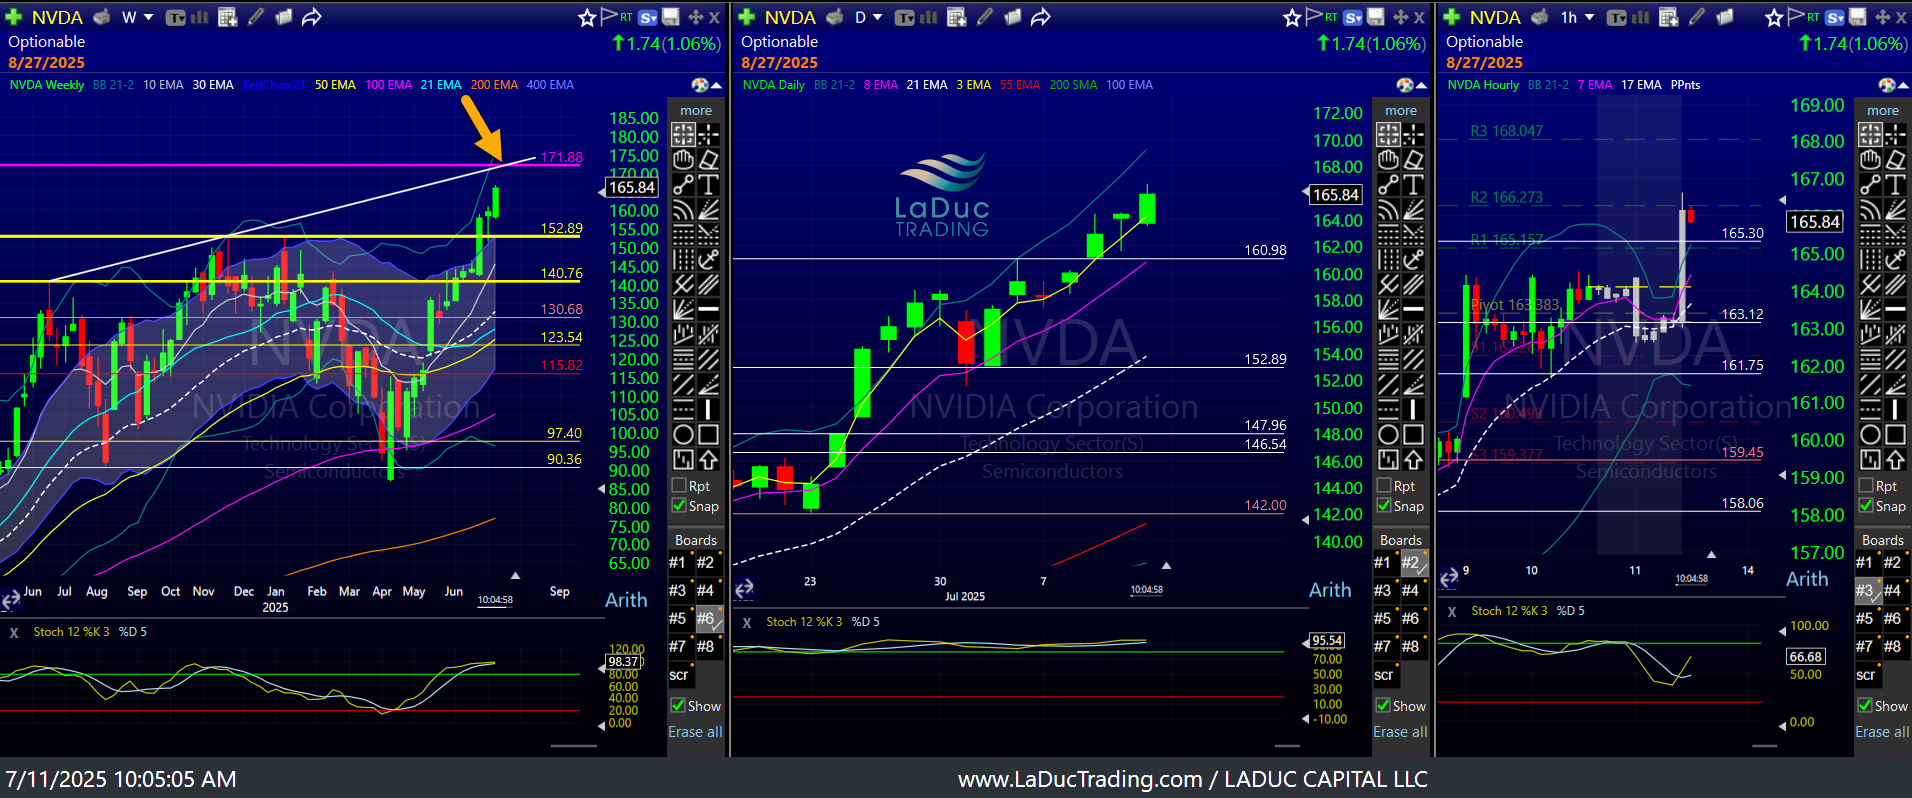
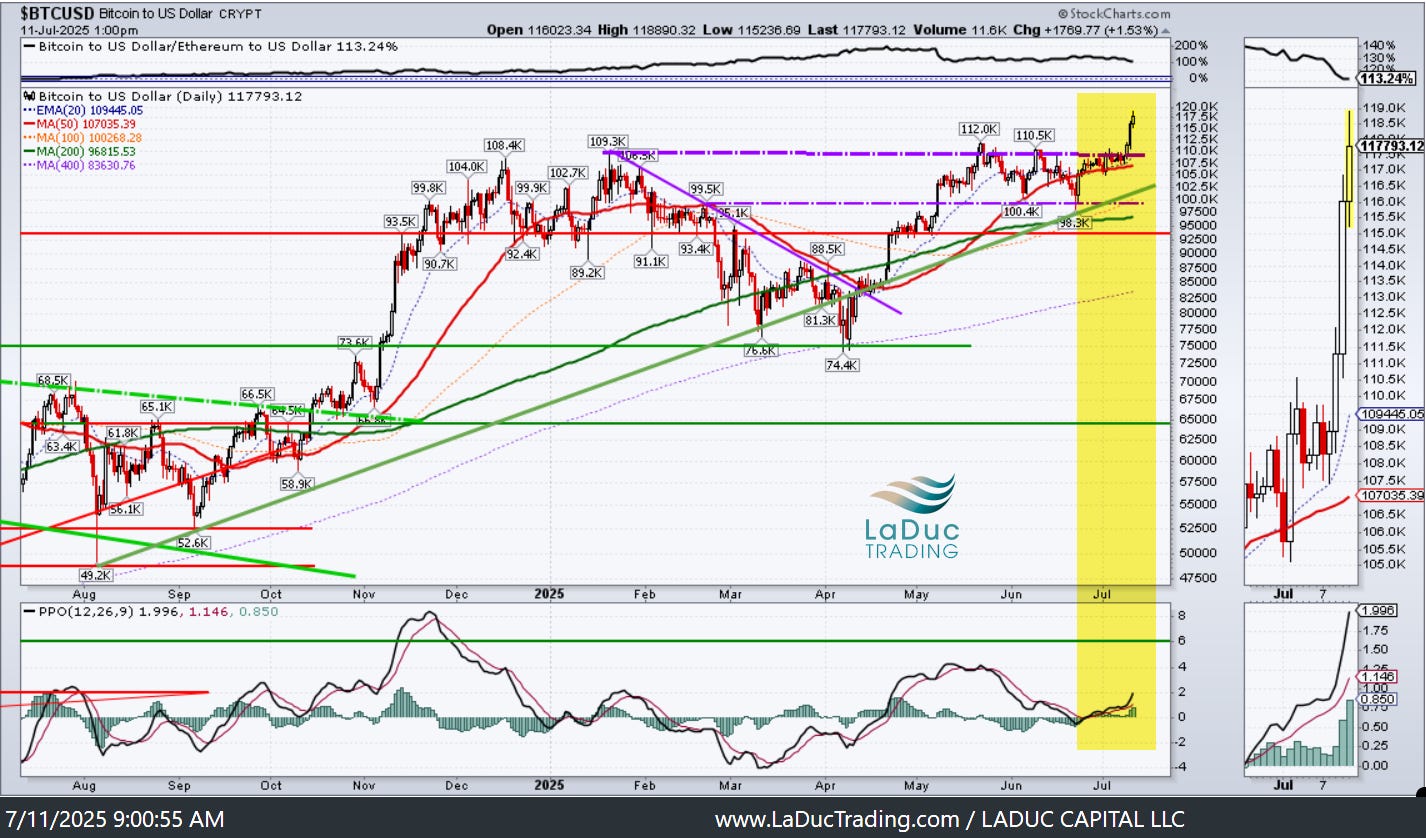
NVIDIA and Bitcoin made all-time highs yesterday. I alerted NVDA on Tues for a chase to 172.
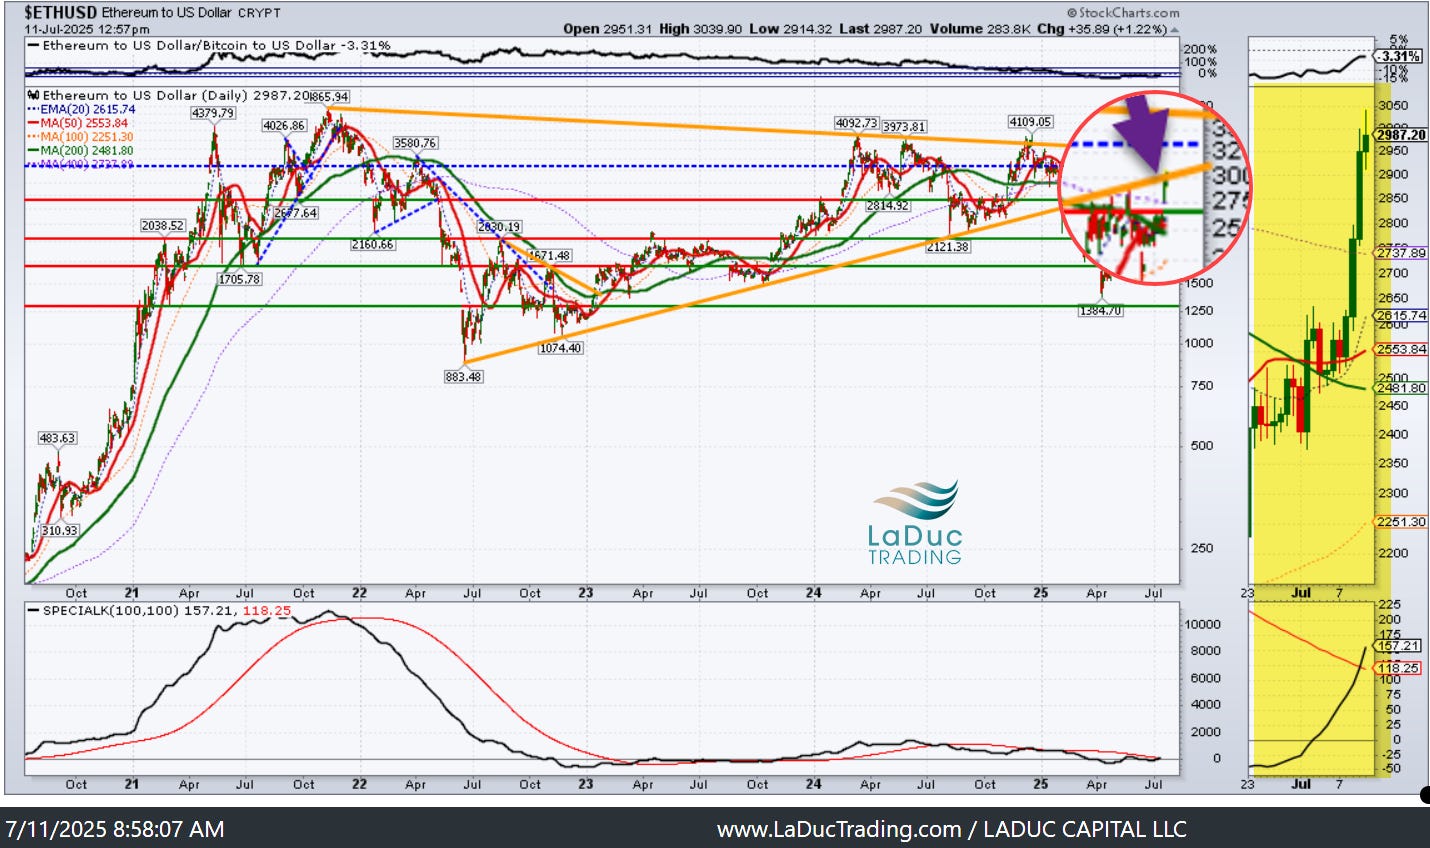
I also posted very bullish BTC/USD & ETH/USD charts just before the breakout.
Now let’s see HOW bullish ETH really is…
Earlier in the week, NDX and S&P made all-time highs. We had selling on the top line Mon & Wed but not underneath. Even yday live when market was fading, I said it was too strong under the surface. SPX recovered nicely to not only fill the 6271.35 hrly gap fill I called out but close above it.
VIX even tagged 15.70 yday - but not yet my 15.50. It will.
Then last night, after Trump declared 50% tariffs on Brazil earlier in the day, he slapped 35% tariffs on our largest trading partner: Canada.
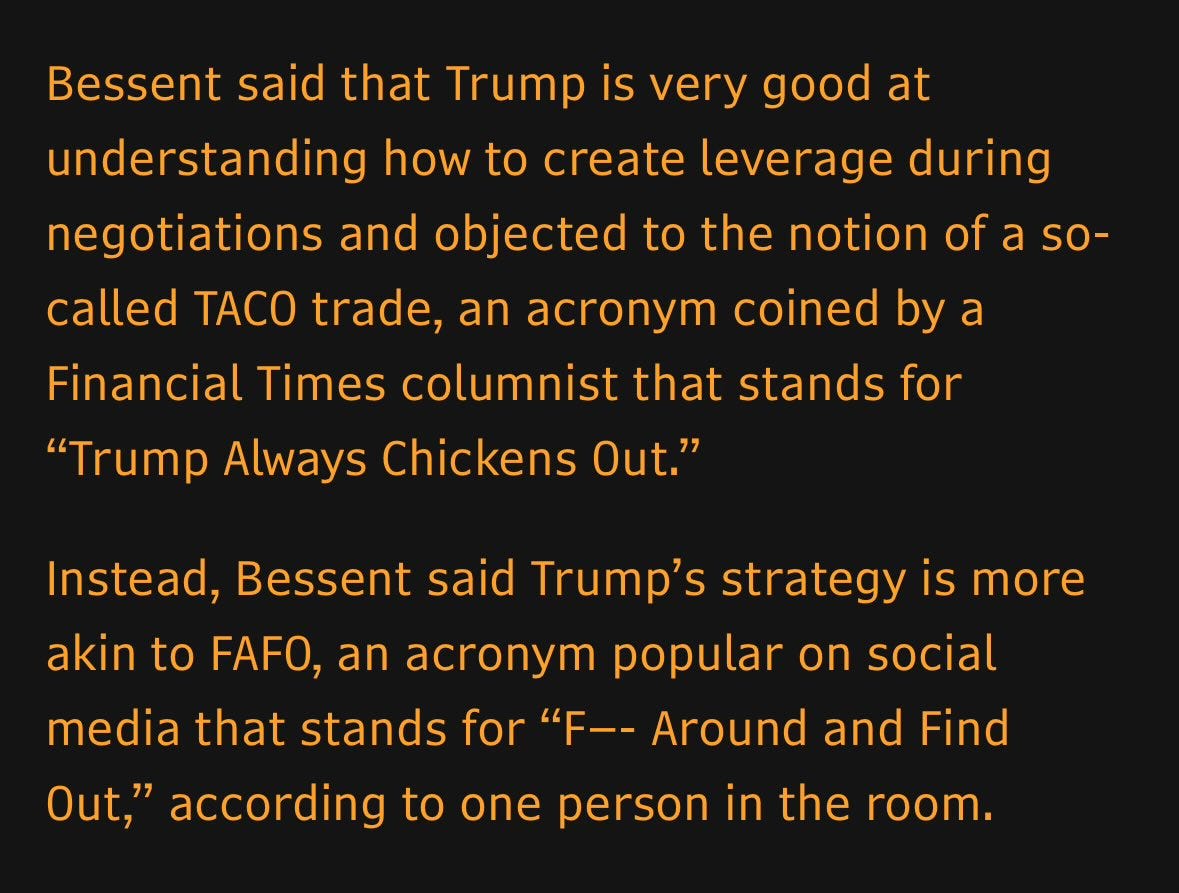
Futures fell -.5% last night as market starts to wonder... is TACO man coming back? Or as Bessent threatened: it's more like FAFO?
With that, VIX is pushing 16.50 as I write, but it is not a threat until above 19.50. And more to the point again, IT’S NOT TIME.
Intraday liquidity IS softening (-.26 CUM VOL) but NVDA is still green and still looking strong into potential 172 PT in the near future.
Tues: if NVDA stays below 159 it can drop to 150. If it gets/stays above 161 it can form a weekly doji sandwich and run to 172.
It's running higher so VIX won't likely get the traction bears would like.
It's just not time for VIX, yet. But that doesn't mean you don't hedge for AUG volatility into SEPT/OCT.
Imran Lakha highlights why this is also a good idea:
"While spot VIX dropped below 16, following realised vol into the single digits, something else happened under the surface.
The VIX curve developed one of the steepest rolldowns I’ve seen in months.
August and September VIX futures are holding a sizeable premium over front month contracts. Translation: the market isn’t pricing ‘peace on earth’ – it’s bracing for fireworks after August 1st, when the new tariff deadline hits."
My point: yes, we are extended, and after NVDA tags 172 area, take care. But I don't see the strong selling under the surface needed to get tactically/heavily short the market, yet.
KEY TRADING PATTERNS STILL WORKING
Charts & Levels Reviewed:
NVDA, SPX, UBER, SLV
KSS, TGT, BIDU, JBHT, BTU, CLF, MSOS
UUUU, CSX, RCAT, ACHR
AG, BA, FCX, UFO, COPX, XME, NEM
AMD, NXPI, STM, ON, DELL, QCOM, MRVL
FLR, VLO, MPC, PBF
IWM, UUP, DOW, FSLR
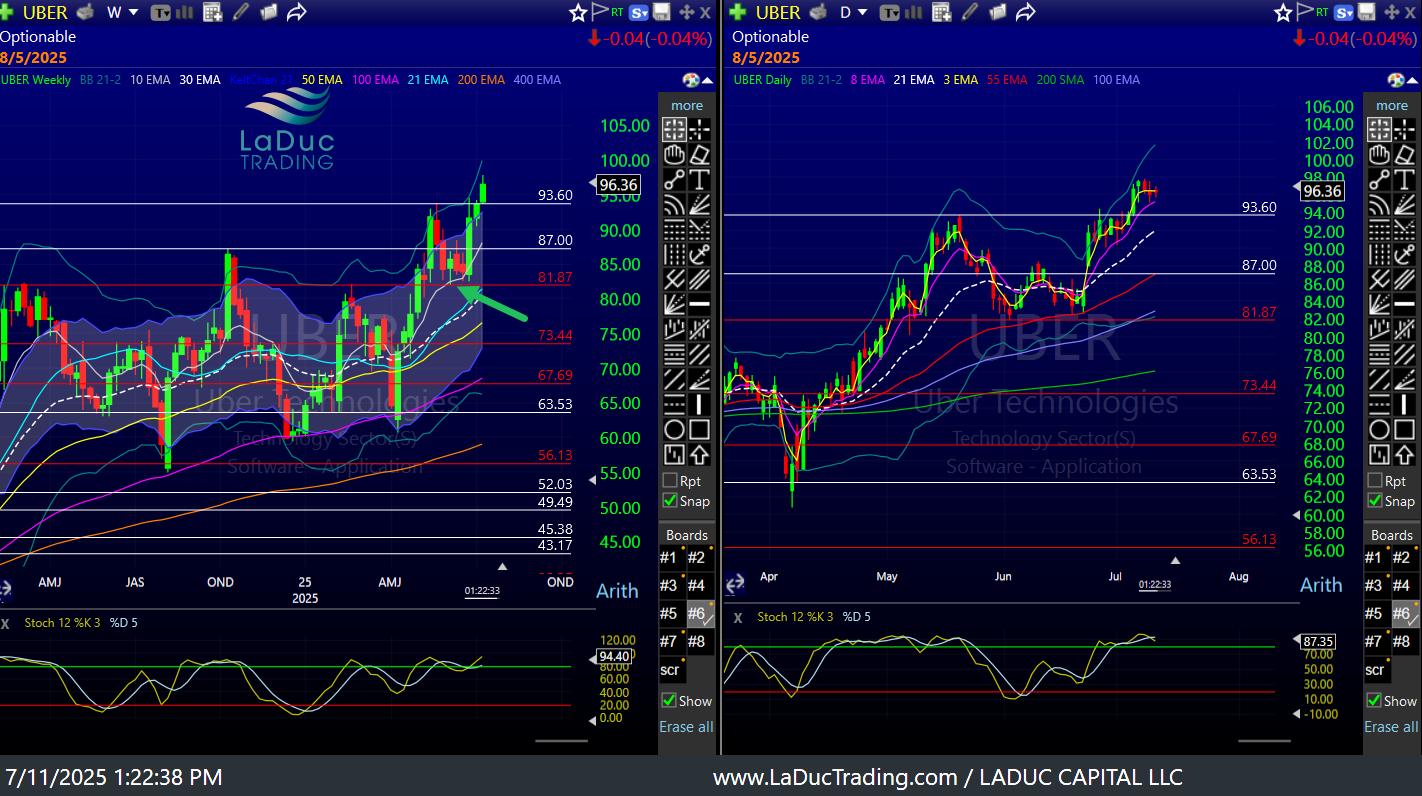
Trading all-time-highs is a solid strategy for those who prefer ‘blue skies’. That’s the ultimate ‘trend-trading’. Case in point: UBER. A great example of my May & June rec’d long if 81.87 holds, it will become an “if 80 then 100” stock.
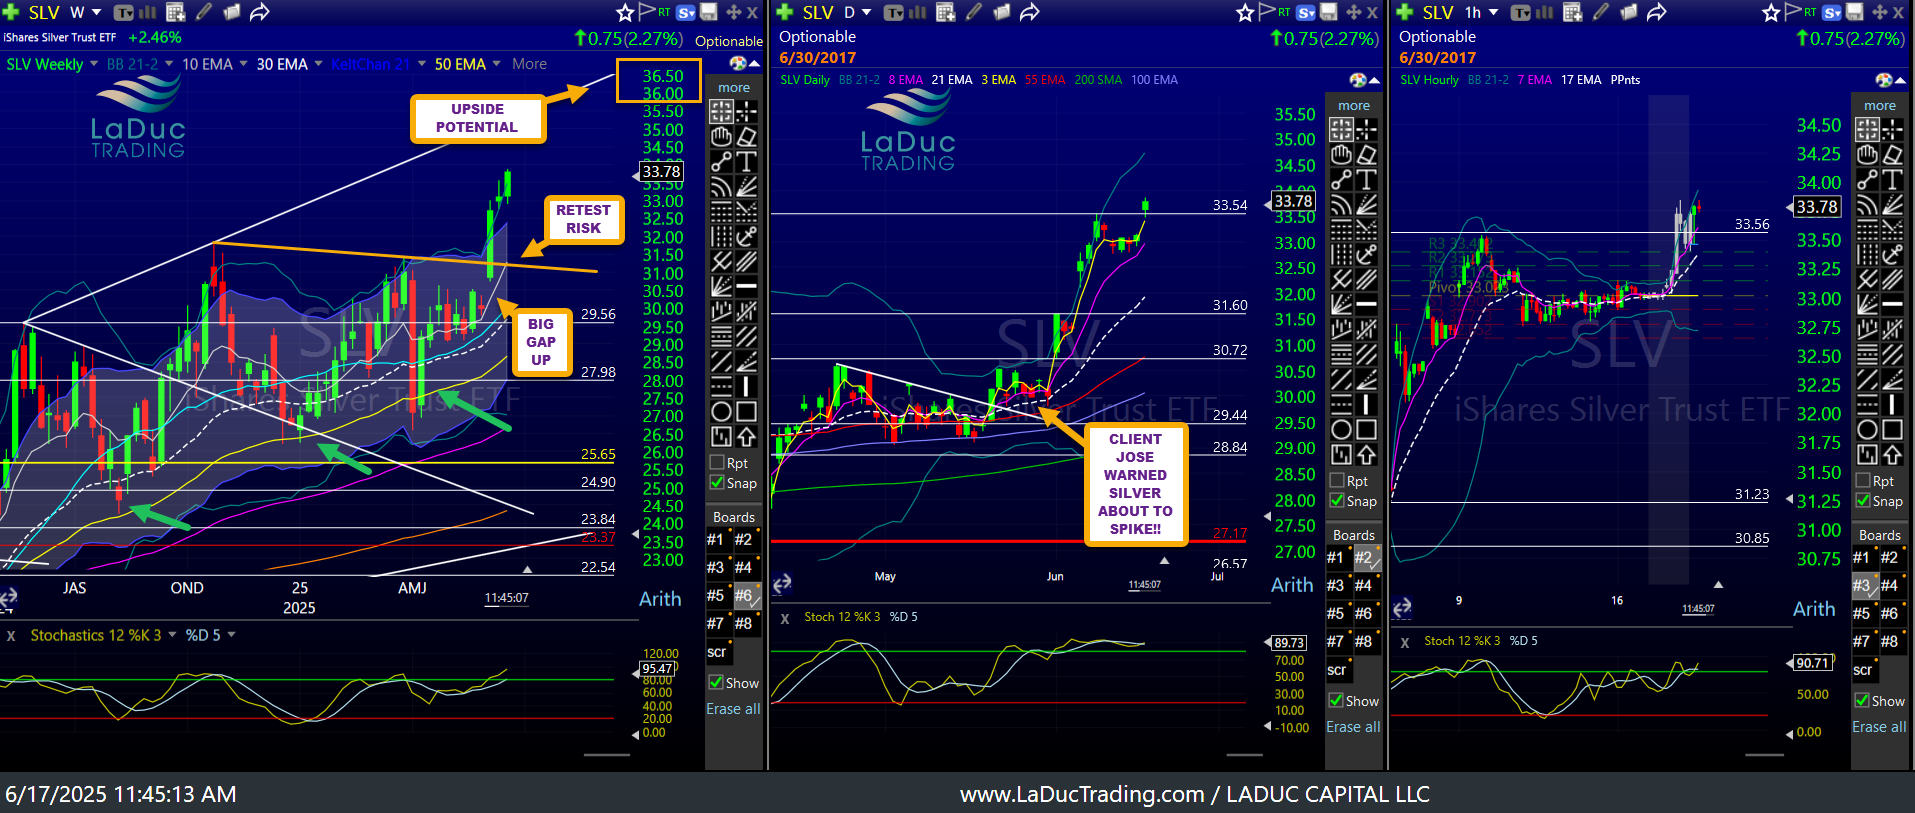
Silver isn’t an ATH stock but it falls into new 52 wk high category! And I should have respected this posted June chart more instead of growing overly cautious of late while it digested sideways the past month.
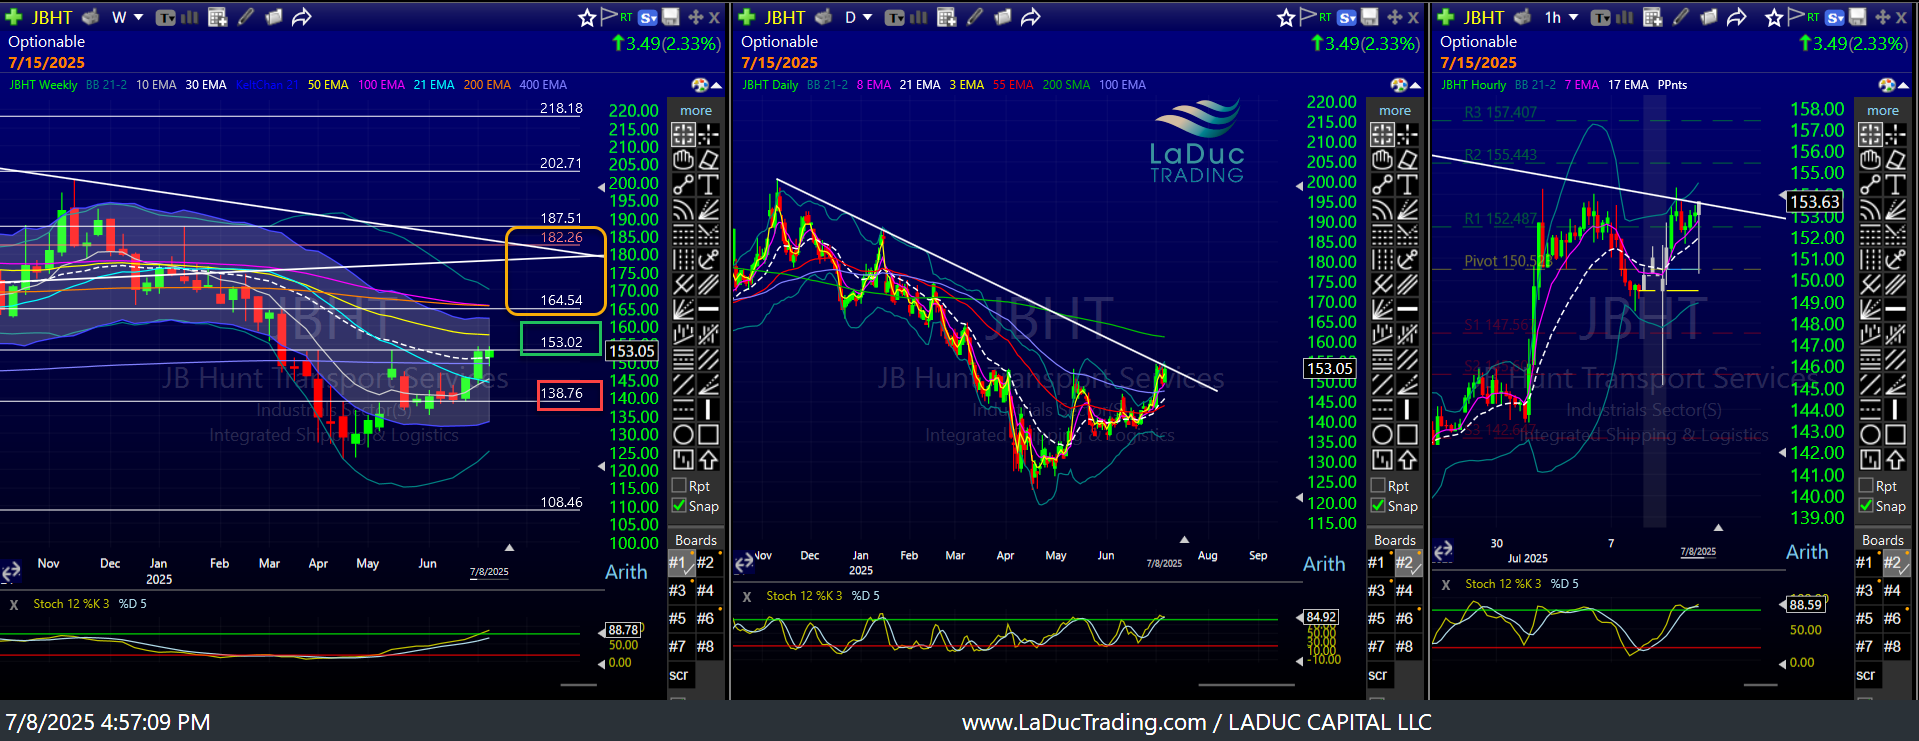
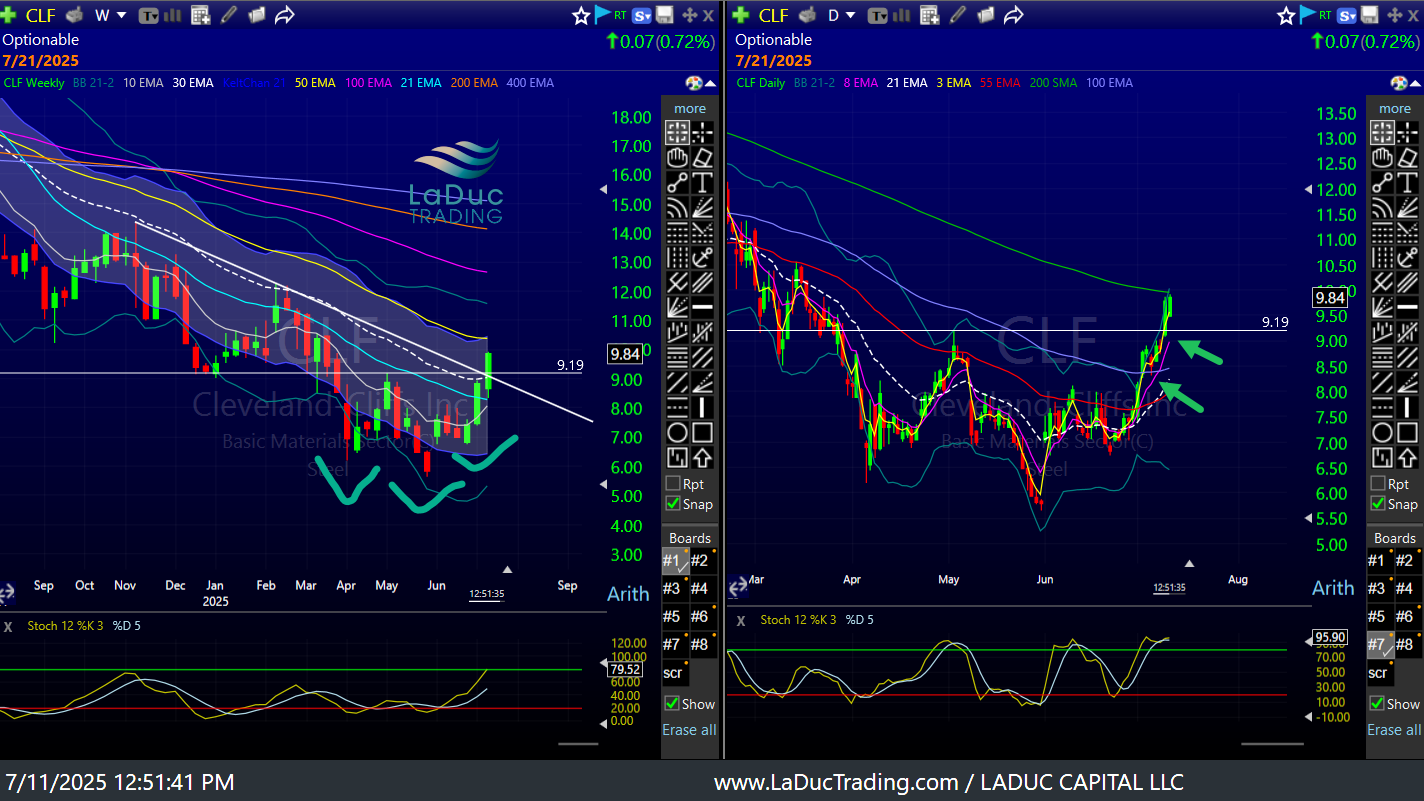
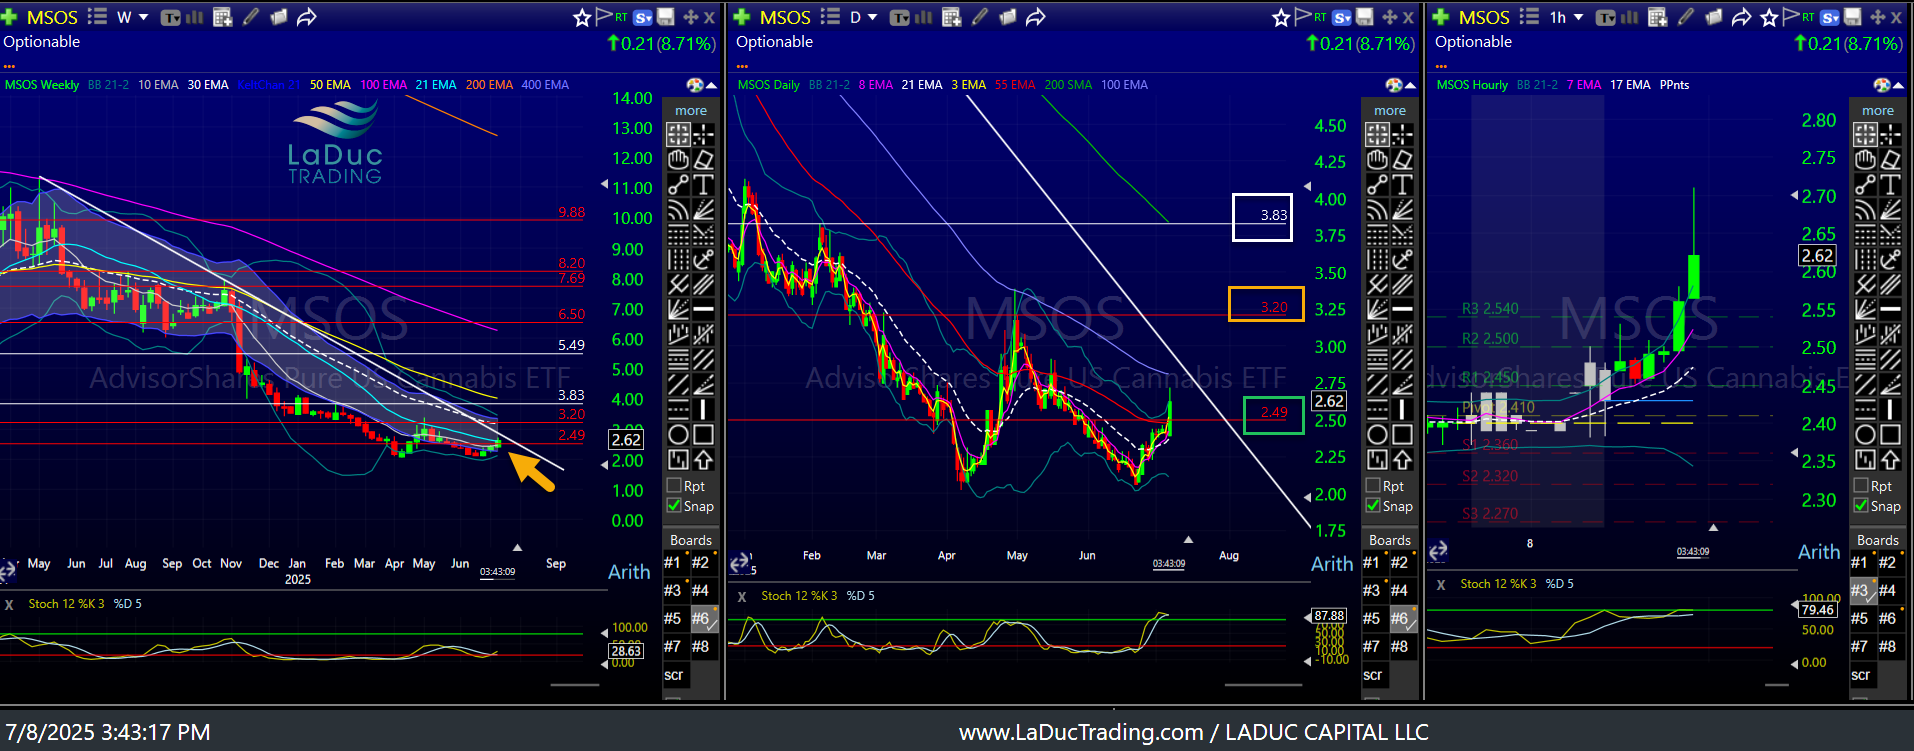
We have spent a fair amount of time each day sizing up the bottom fishing plays - where a weekly 10/21 crossover is in play with bullish weekly candle formations +/or patterns. Examples: KSS > 9.96, TGT >103, BIDU > 90.45, JBHT > 156.74, BTU > 15.60 - but they haven’t triggered. CLF > 9.19 and MSOS > 2.75 already did.
MOS already tagged 3.20 after recommending, and is digesting well above 2.49.
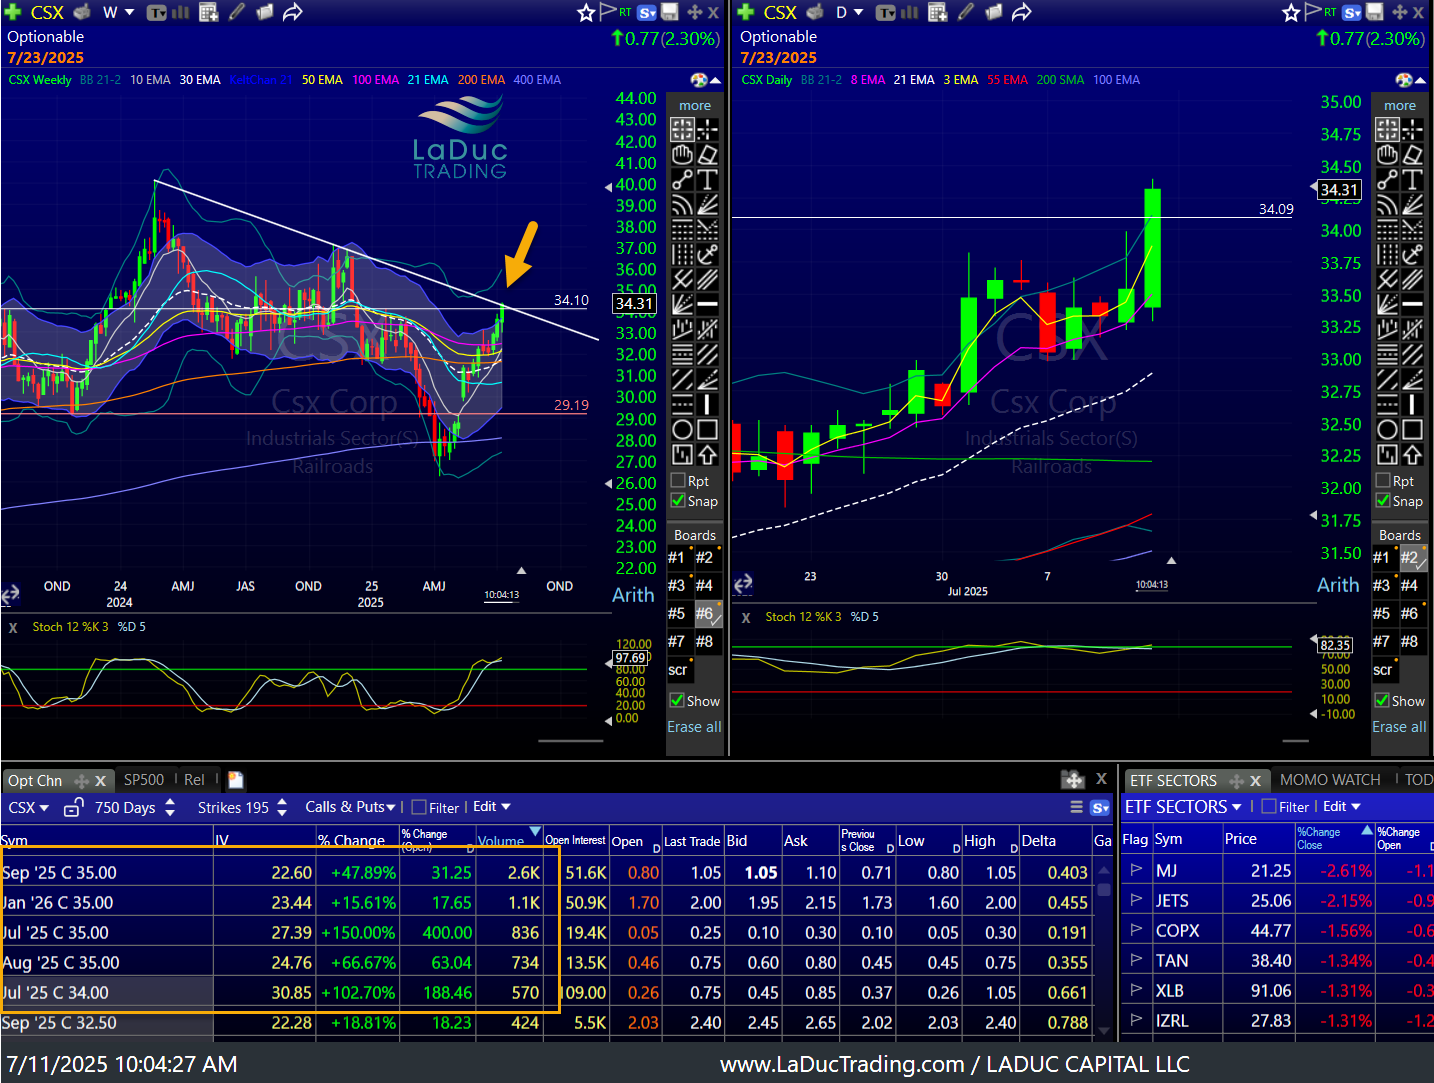
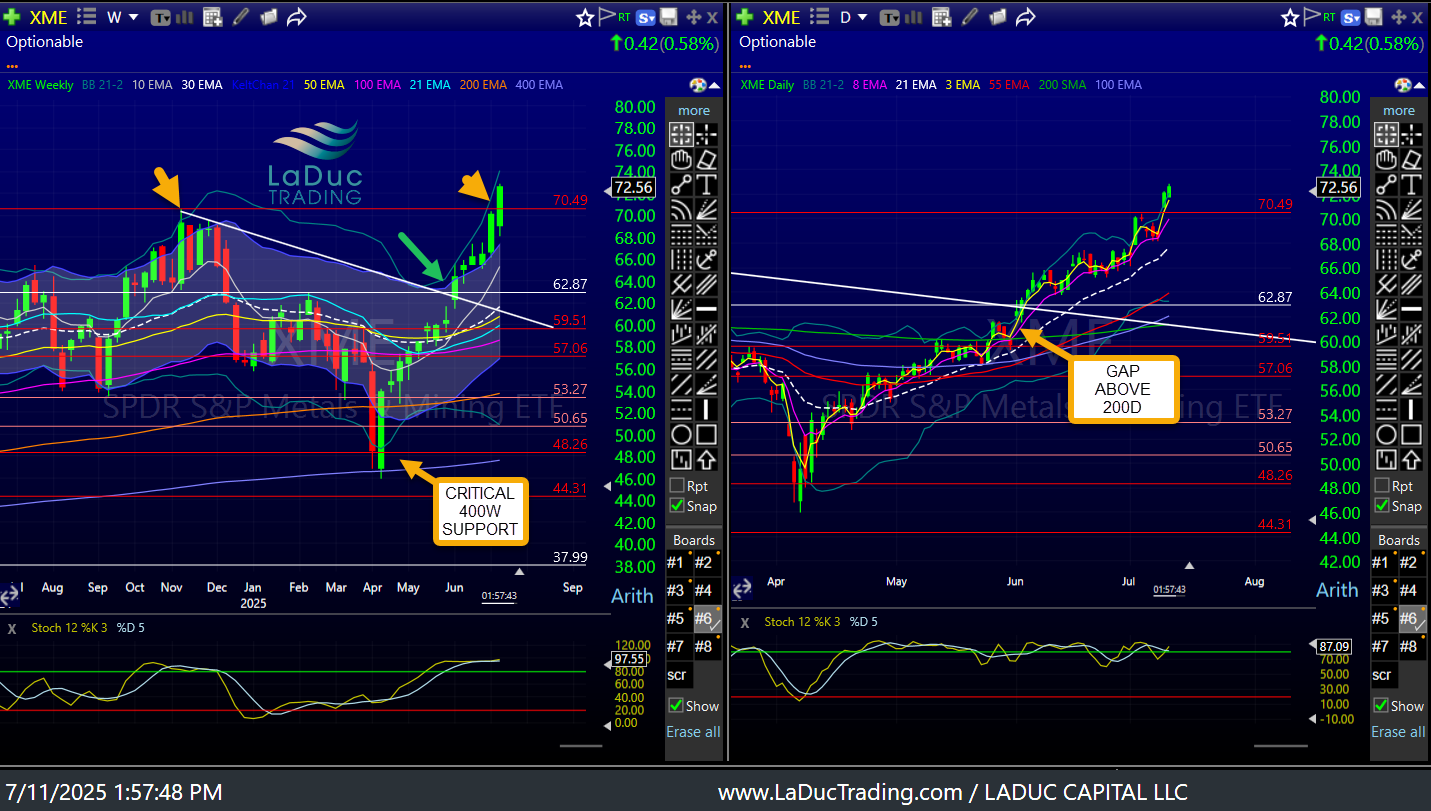
Other patterns for continued breakout are the descending weekly trendline - which serve as PT long and then support once above. Examples: UUUU > 6.70, CSX > 34.10, RCAT > 7.95, ACHR > 11.84, BA > 215, FCX > 48, UFO > 29, COPX > 47, NEM > 59.
They can turn into an XME-type continuation patterns should they continue…
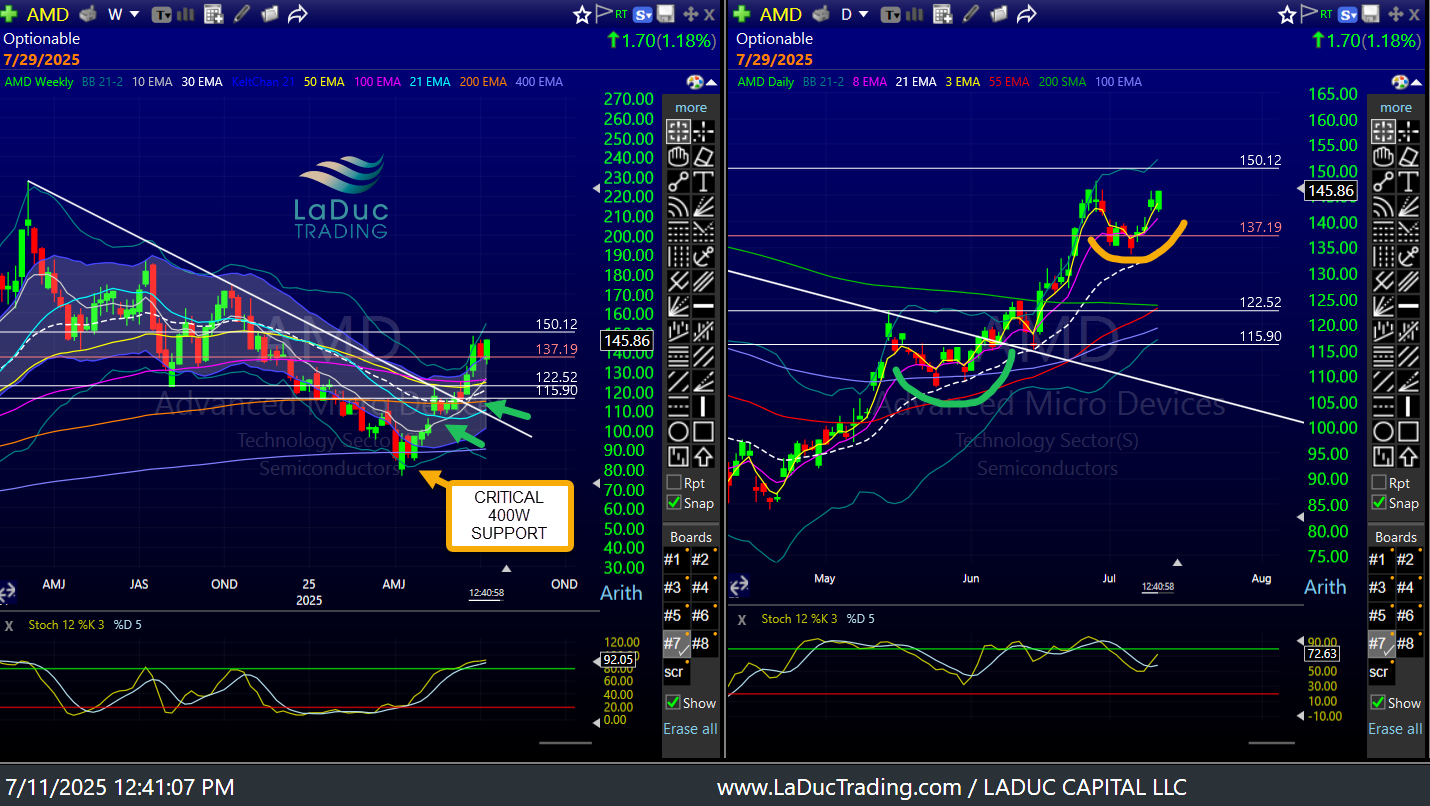
The descending weekly trendline with the weekly scoop pattern with the critical 400W support… has also been especially profitable set up for higher. Example is AMD - in play since bouncing off critical 400W support then tagging that trendline at 121 which formed a great scoop pattern and now needs > 150 in yet another daily scoop pattern.
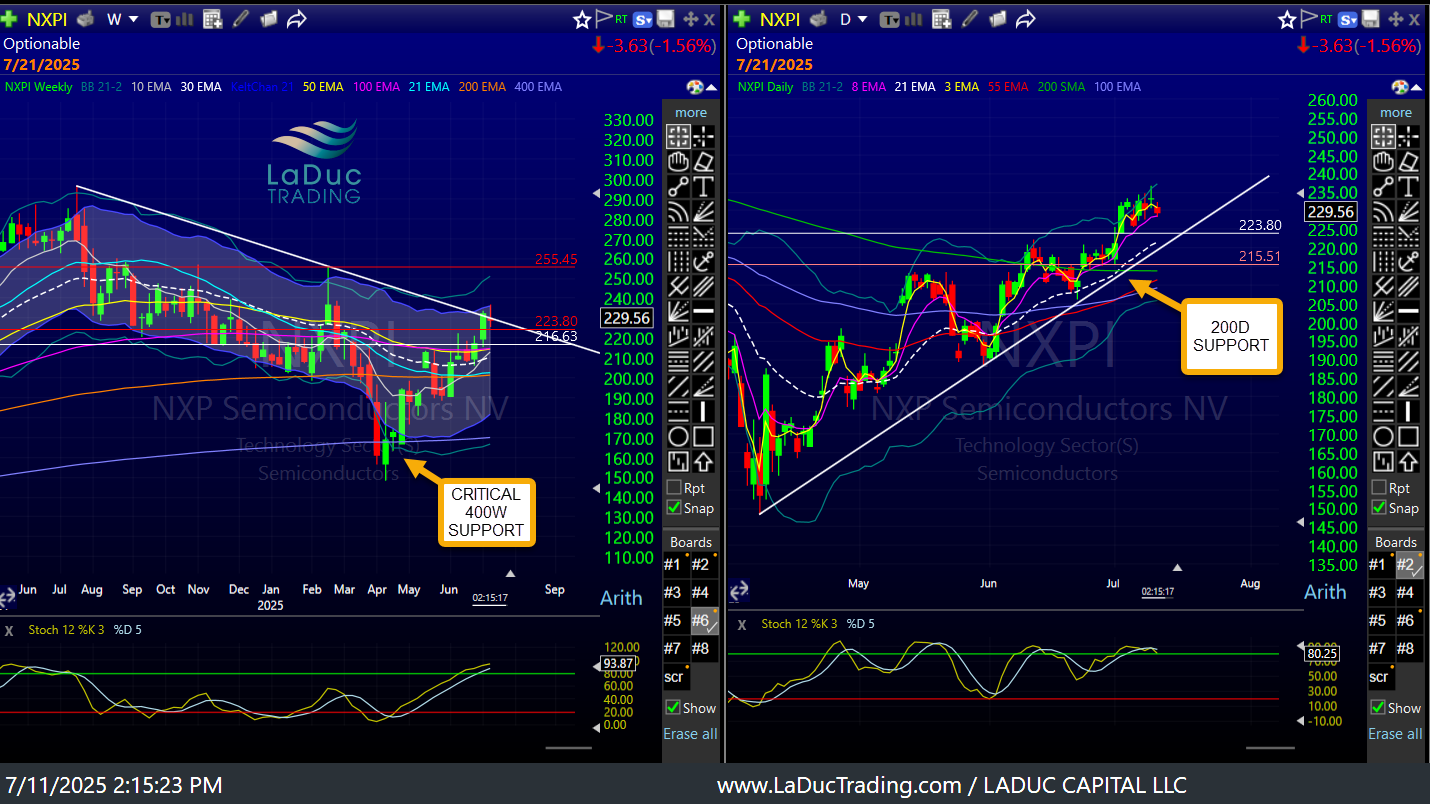
Also, NXPI > 223.80 that I rec’d with STM & ON once they got above their 400W. All worked/working.
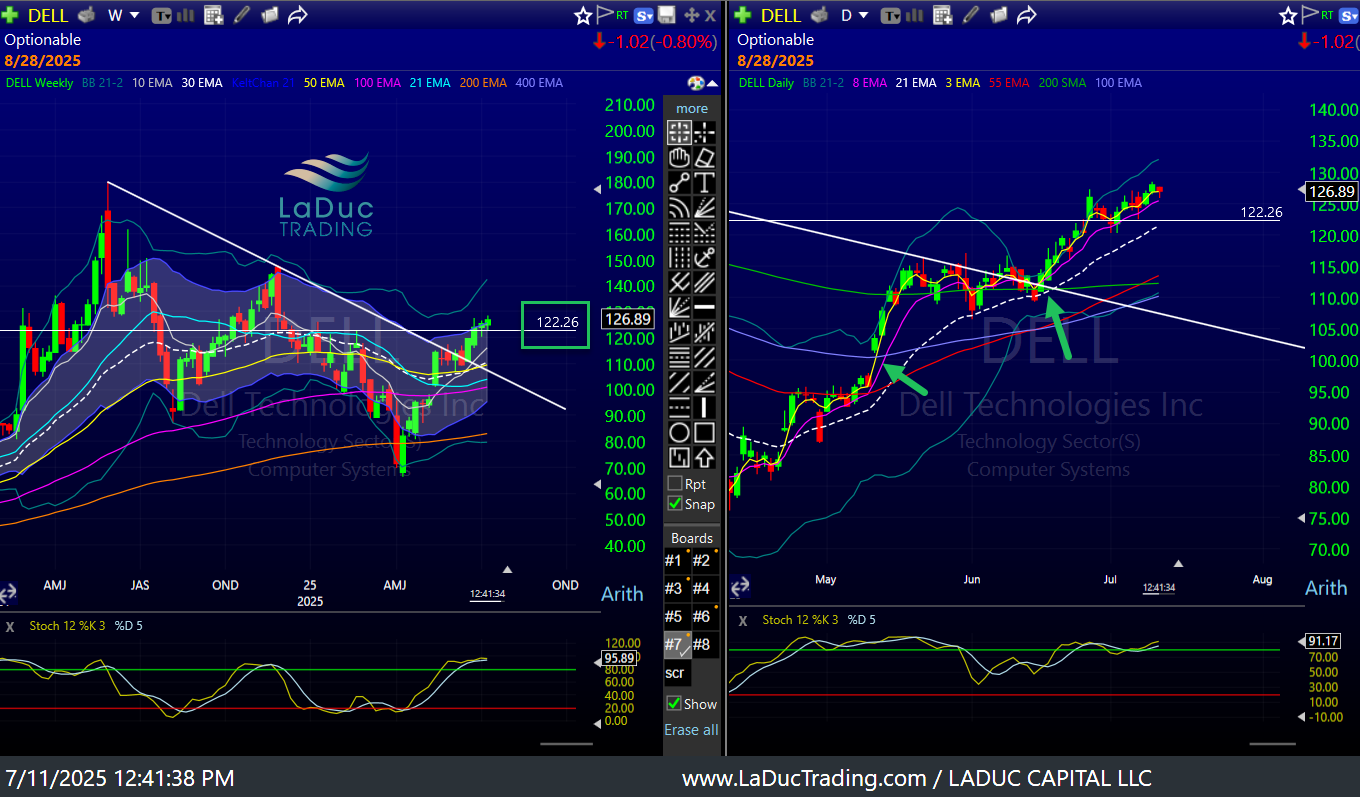
I have pointed out MRVL, QCOM, DELL for similar patterns:
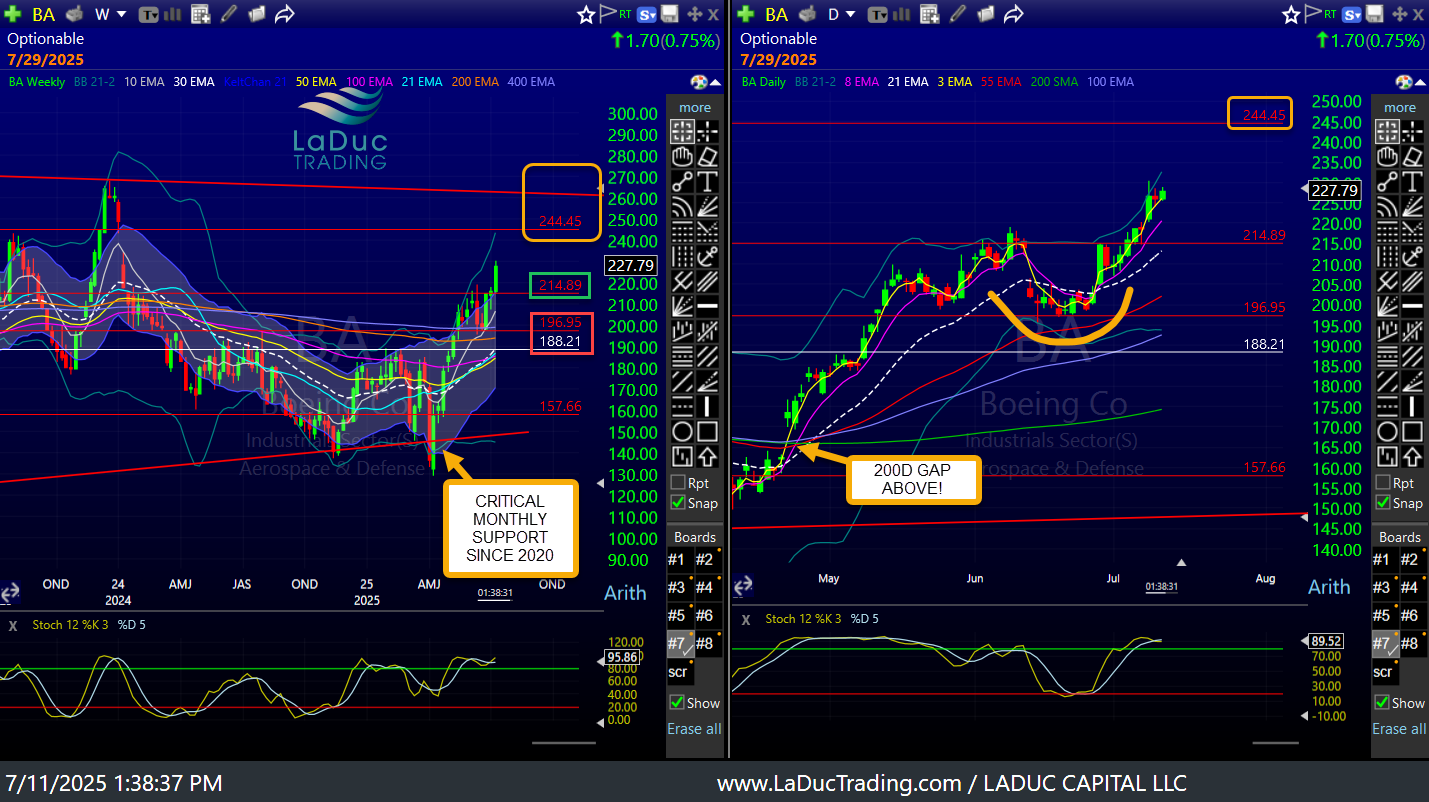
Other bottom fishing plays needed to prove they could get/stay > their 400W. BA is a perfect example I have been very bullish on past few months into 244.45 then 260. AG is another > 8.44.
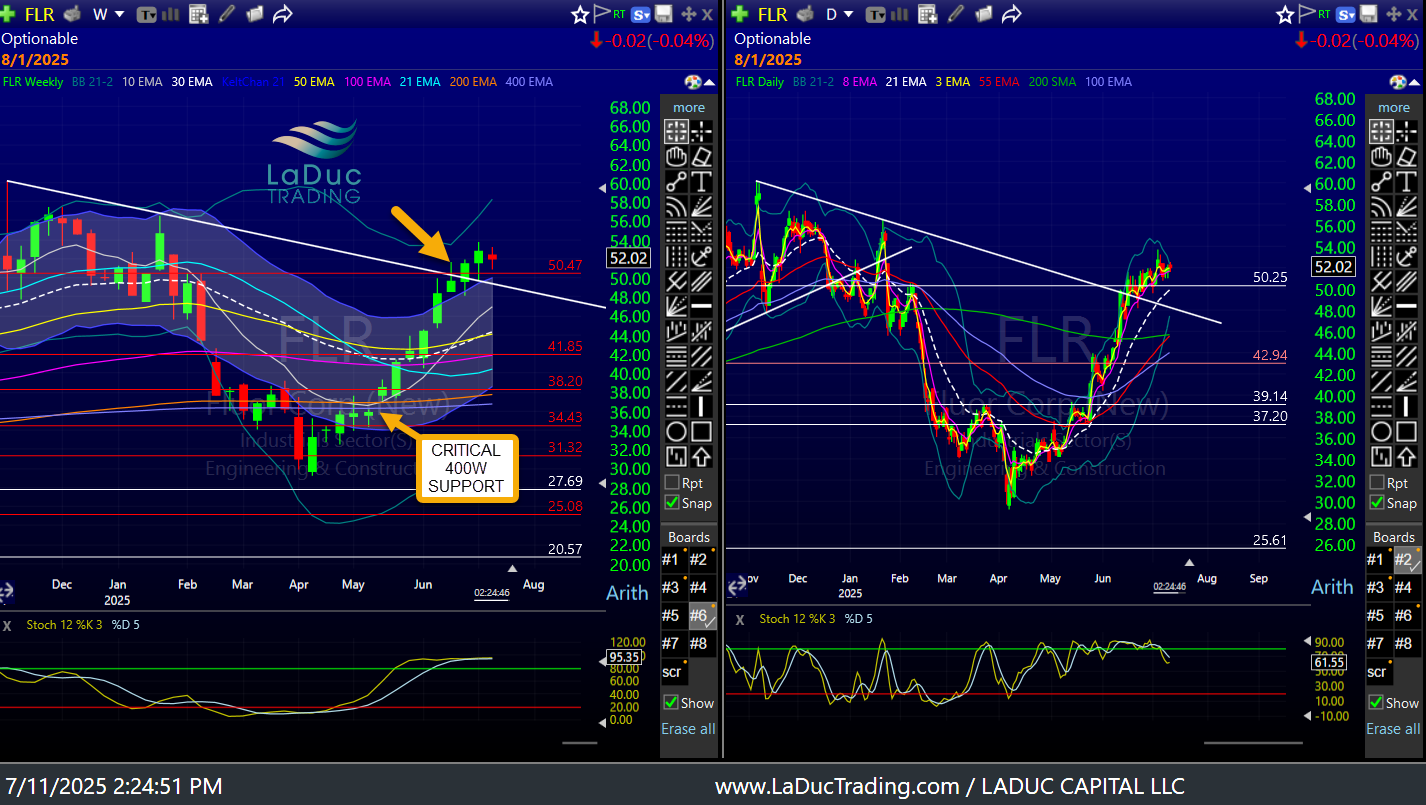
And you know how emphatic I was about FLR moving back up to 50. Now above… This continues to be a great (boring but profitable) TREND LONG since 2021.
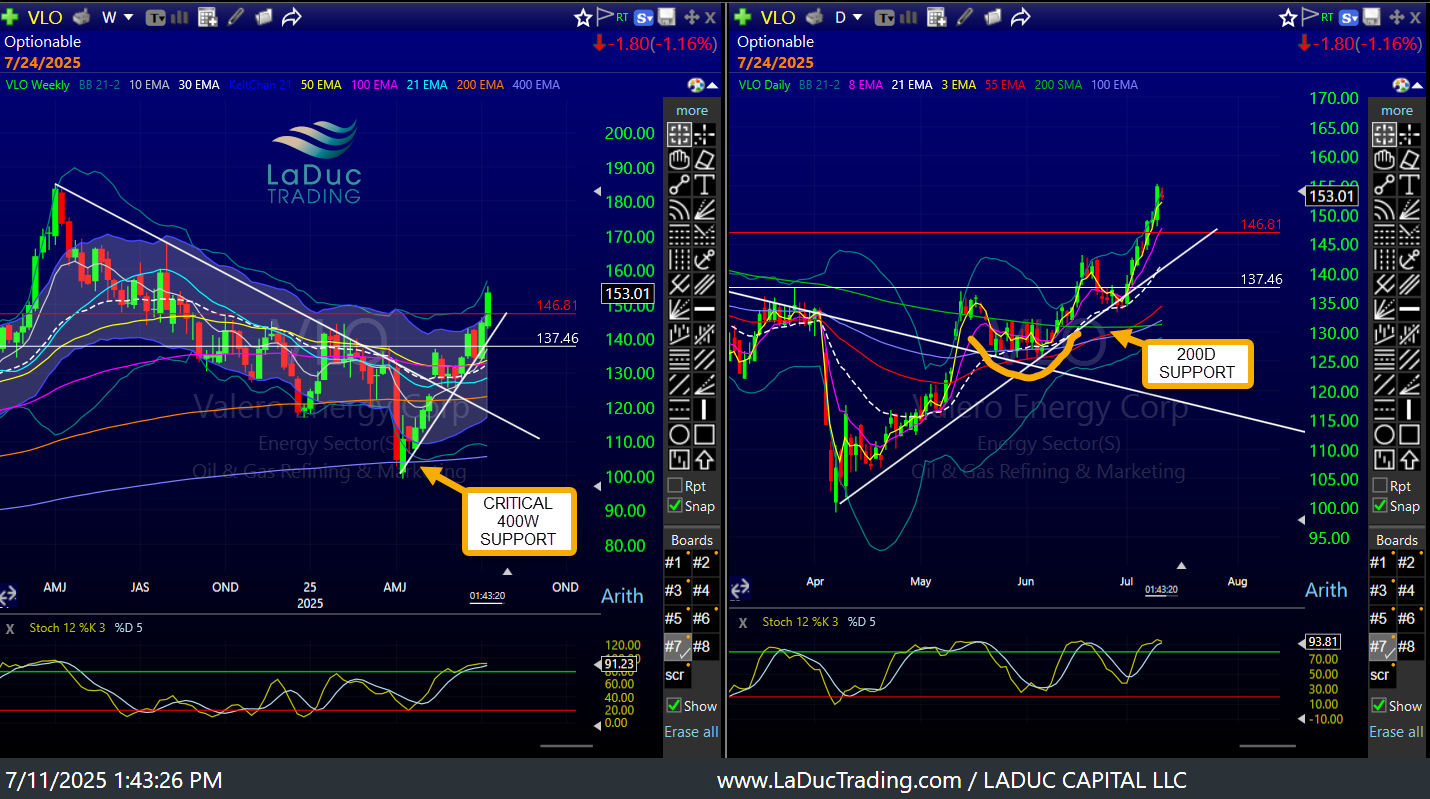
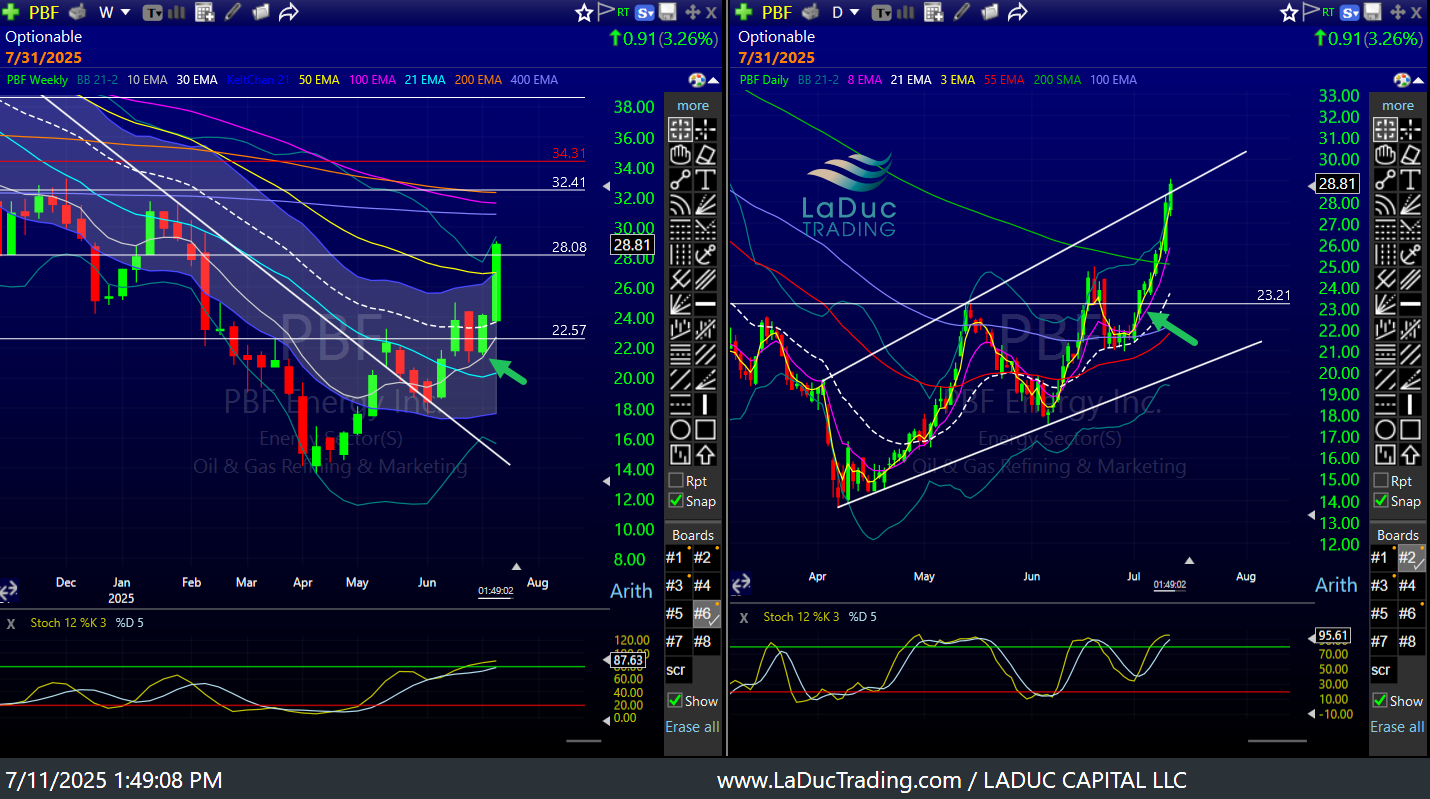
I can’t emphasize enough how important the 400W EMA support level is for any viable company. It is a terrific place to sell puts and/or to accumulate a position if you do not believe it is going away. Case in point: VLO - bouncing off 100 and since hitting 155! Ditto with MPC & PBF. The refiners had a fundamental tailwind as well with Crack spread differential.
PBF is still working its way TO its 400W! Client Brian says it has $25/share in real estate, so big picture, this one looks good, but now it needs to base above its 200D. It will require more patience.
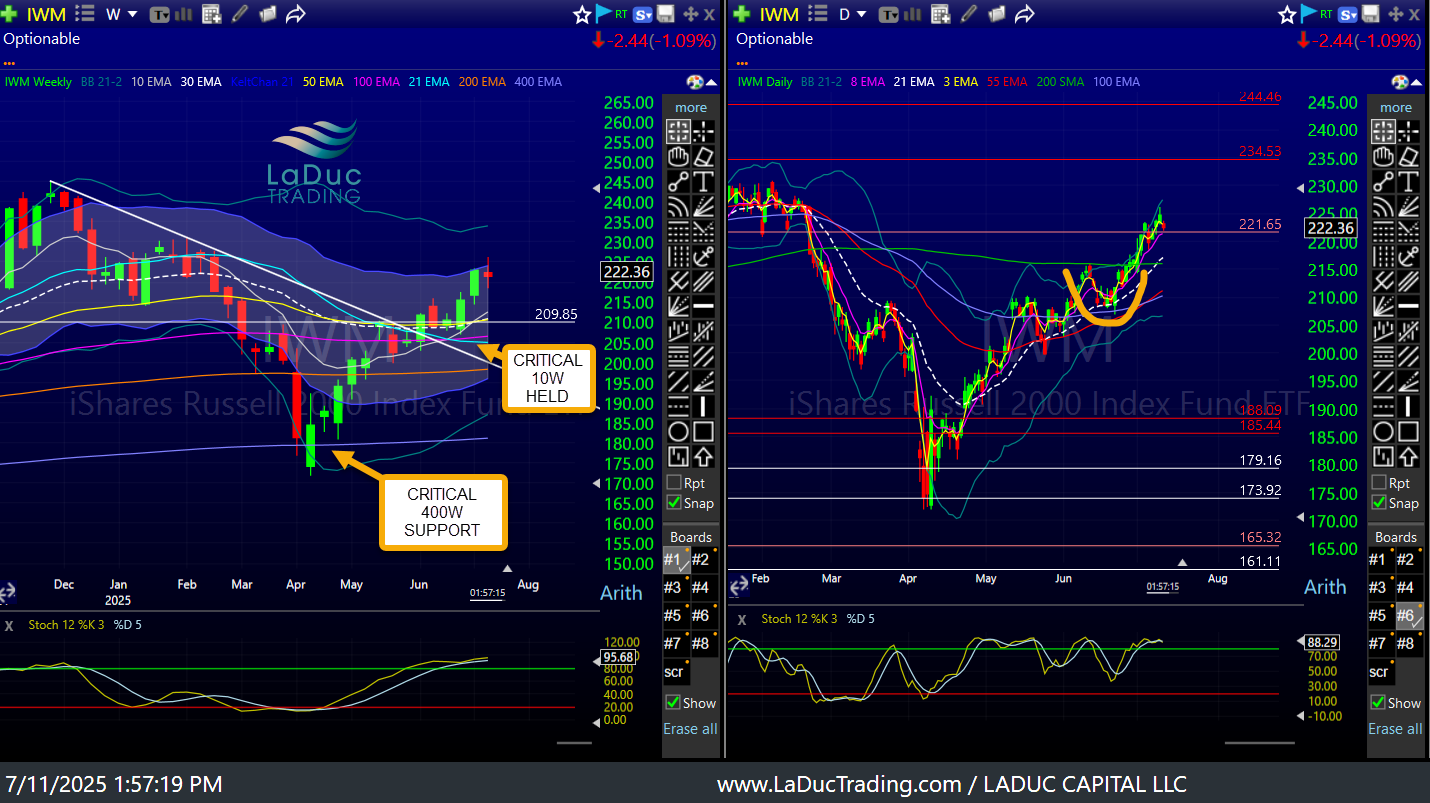
Heck, even IWM bounced solidly off 400W support and the retest of its critical 10W held and TTD is really trying to stay > 65 after boucing off its 400W near 40. UUP is now on 400W…
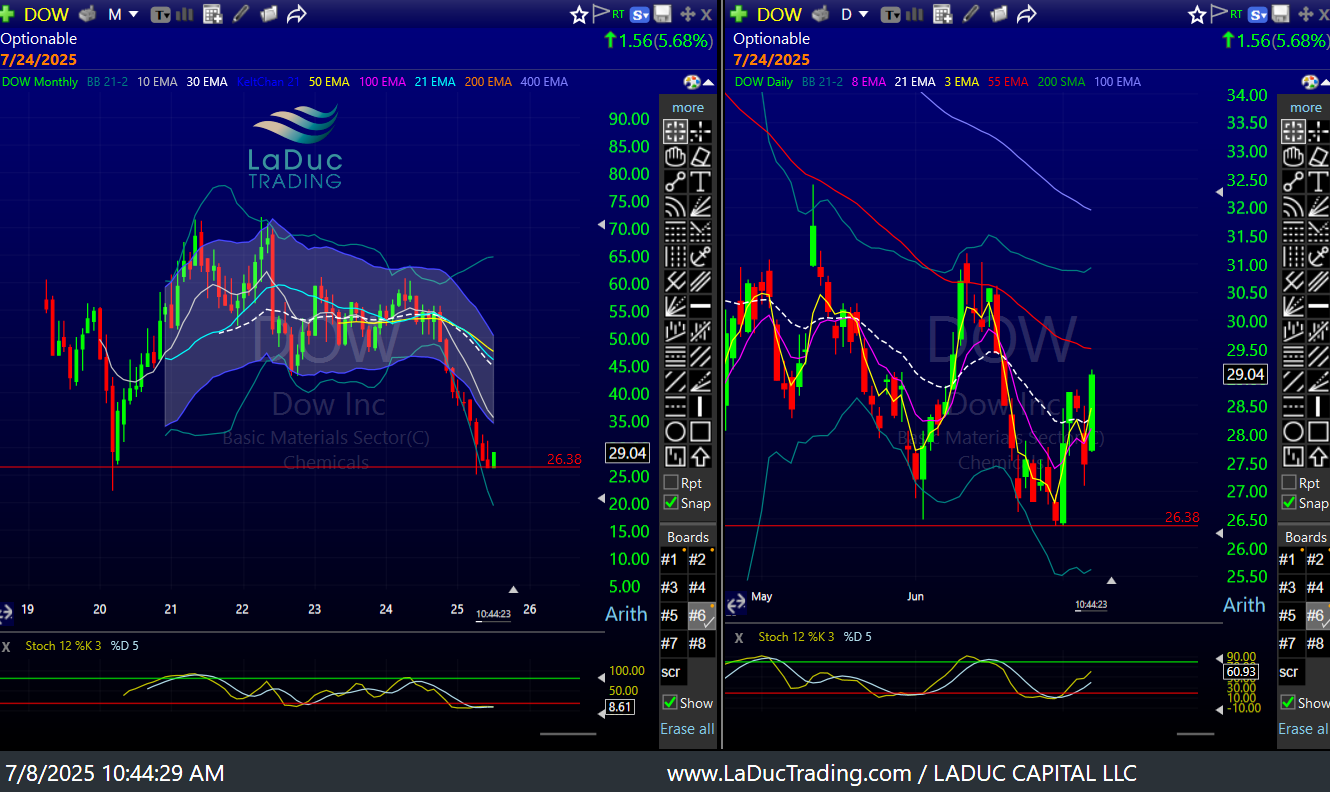
Some stocks are just very oversold, making for a good LRE (low-risk-entry) for the very patient investor. DOW must stay > 26.38 for example...
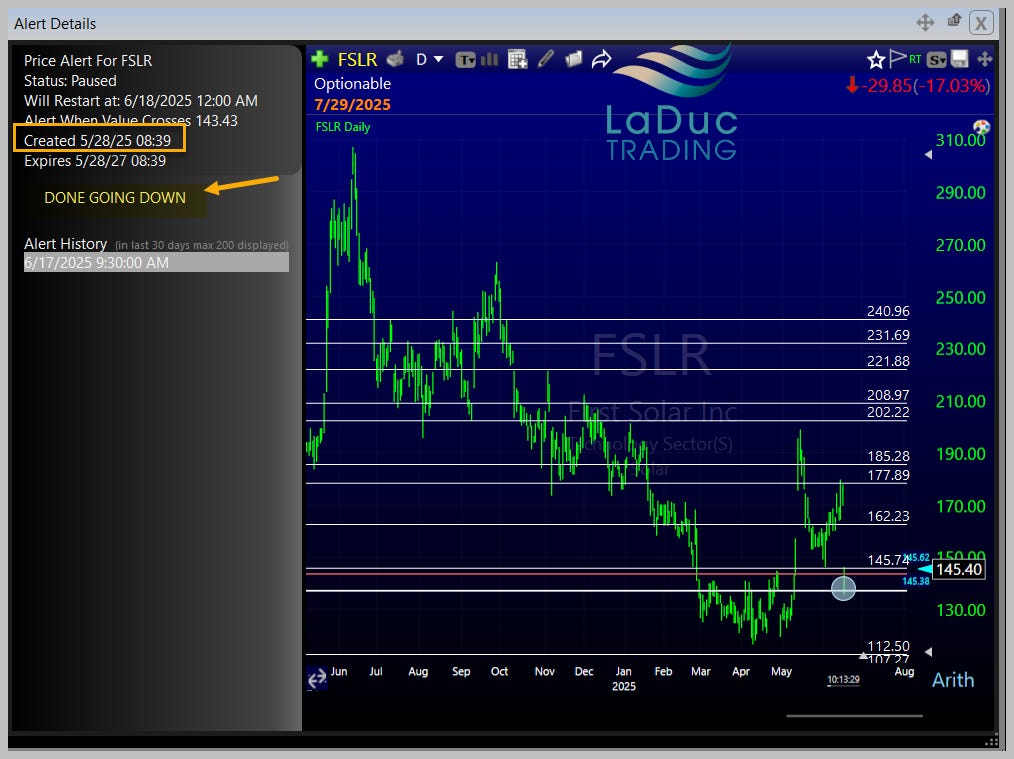
FSLR was a great (anticipated) buy alert at 138 before spiking to 188, but I also said this one will take MONTHS of chopping about in this range before it’s a better/safer trend reversal, bottom fishing play long.
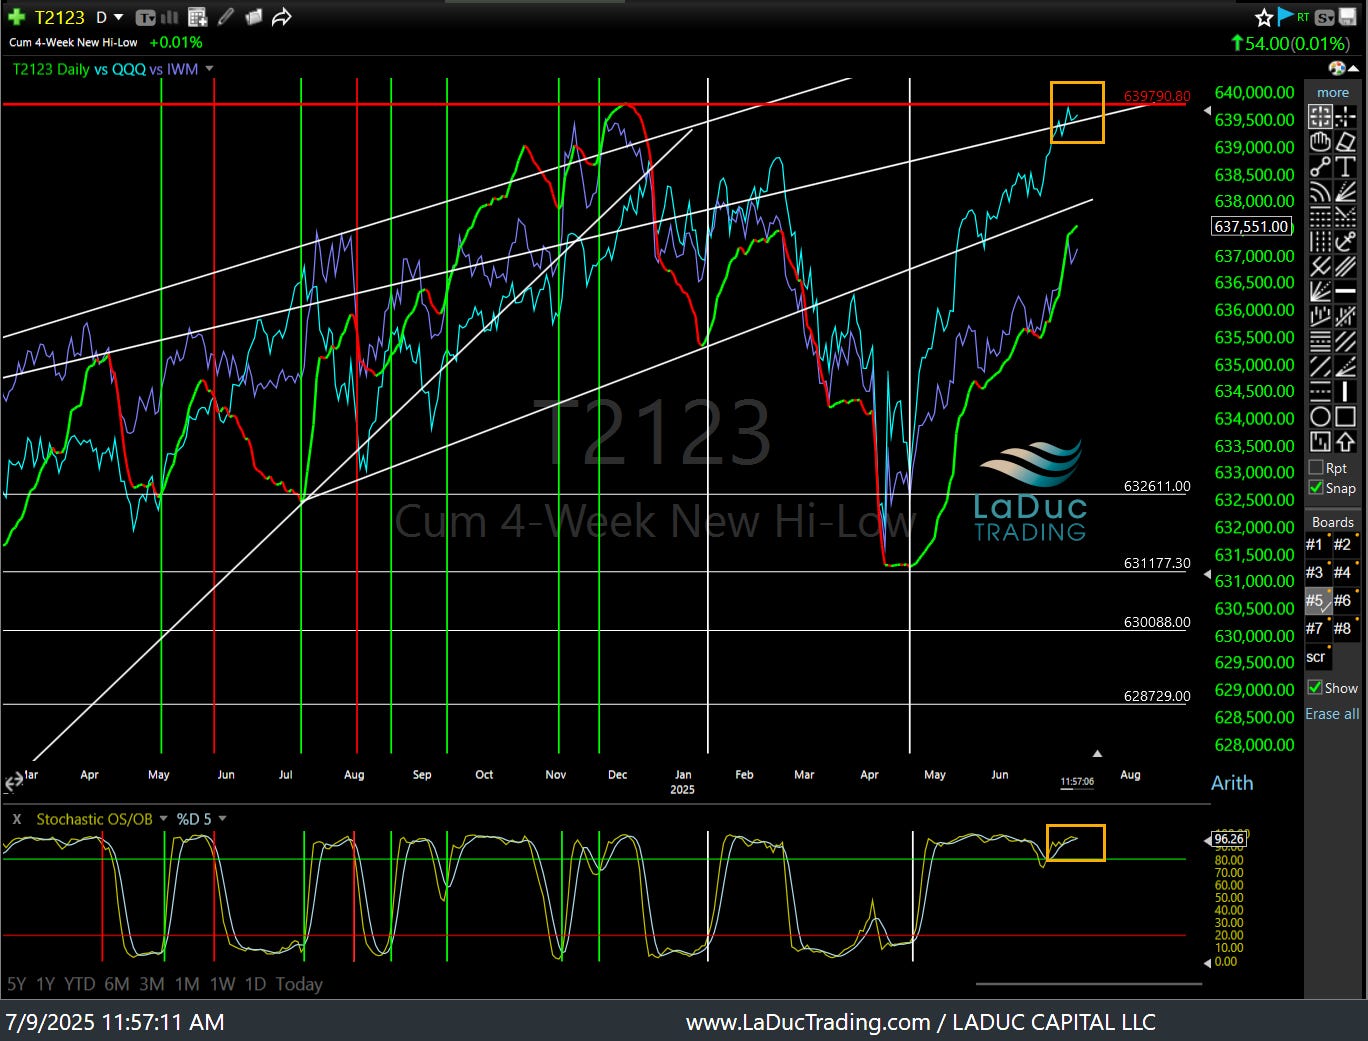
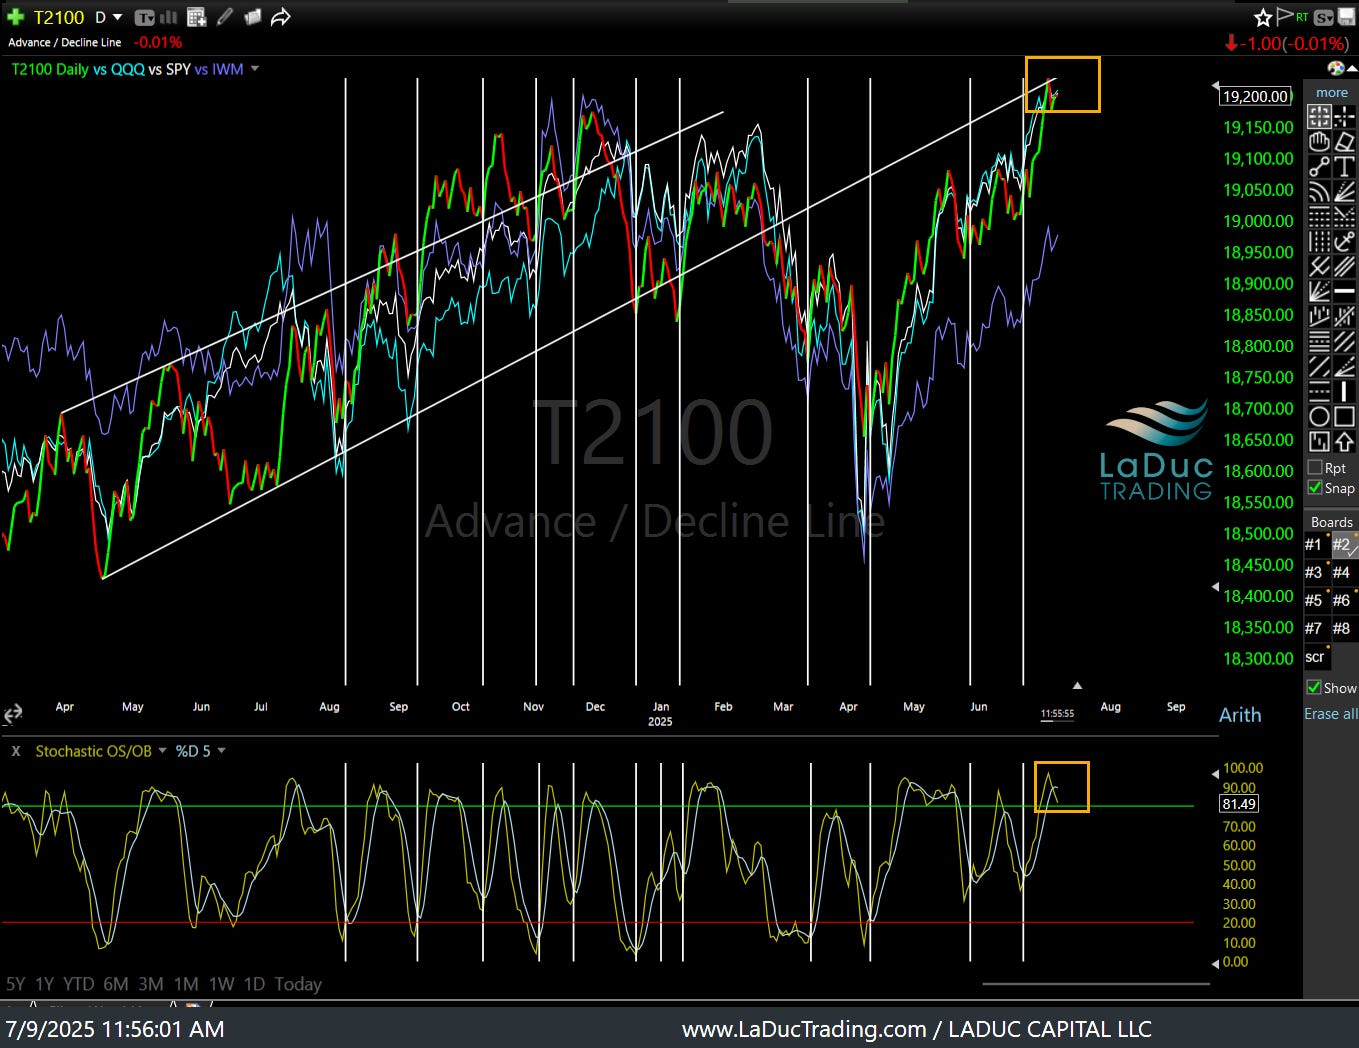
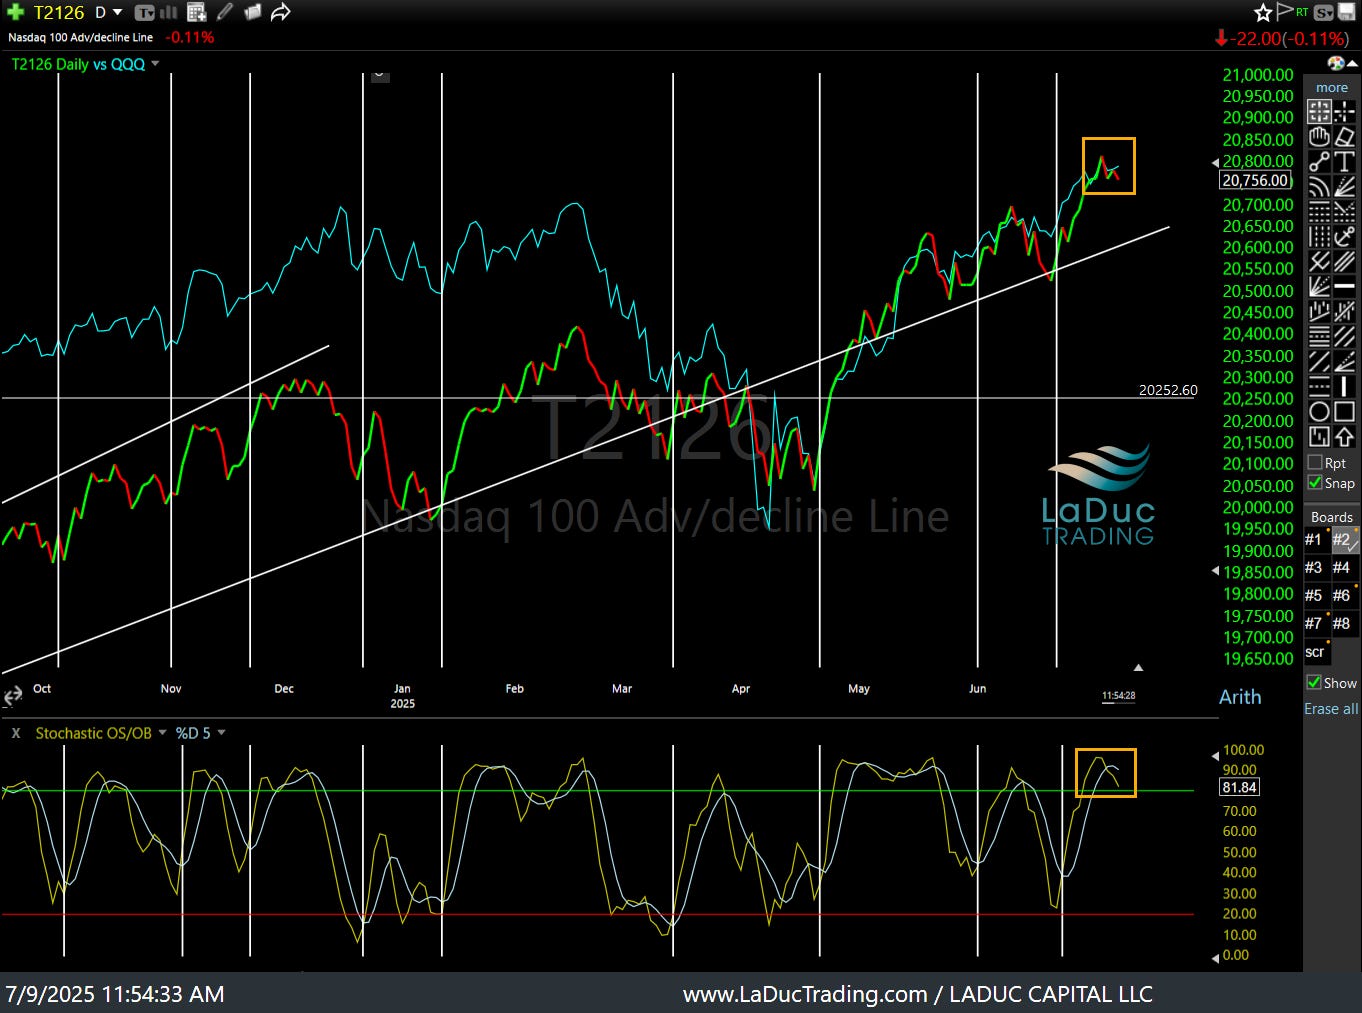
INTERMARKET TELLS - MY SECRET SAUCE
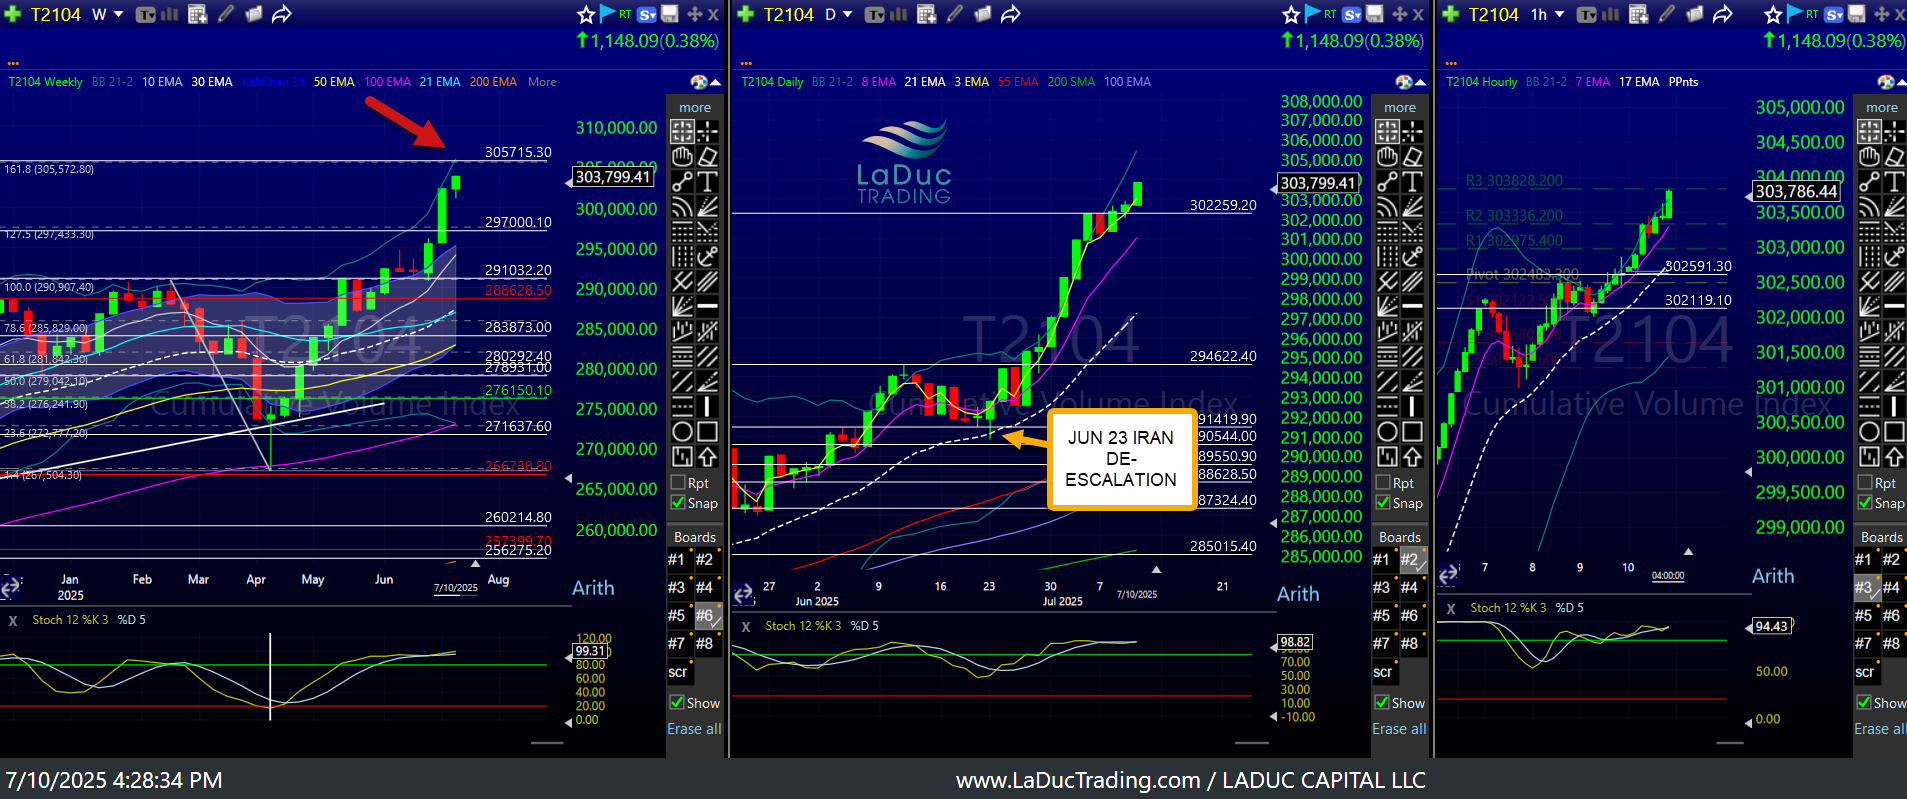
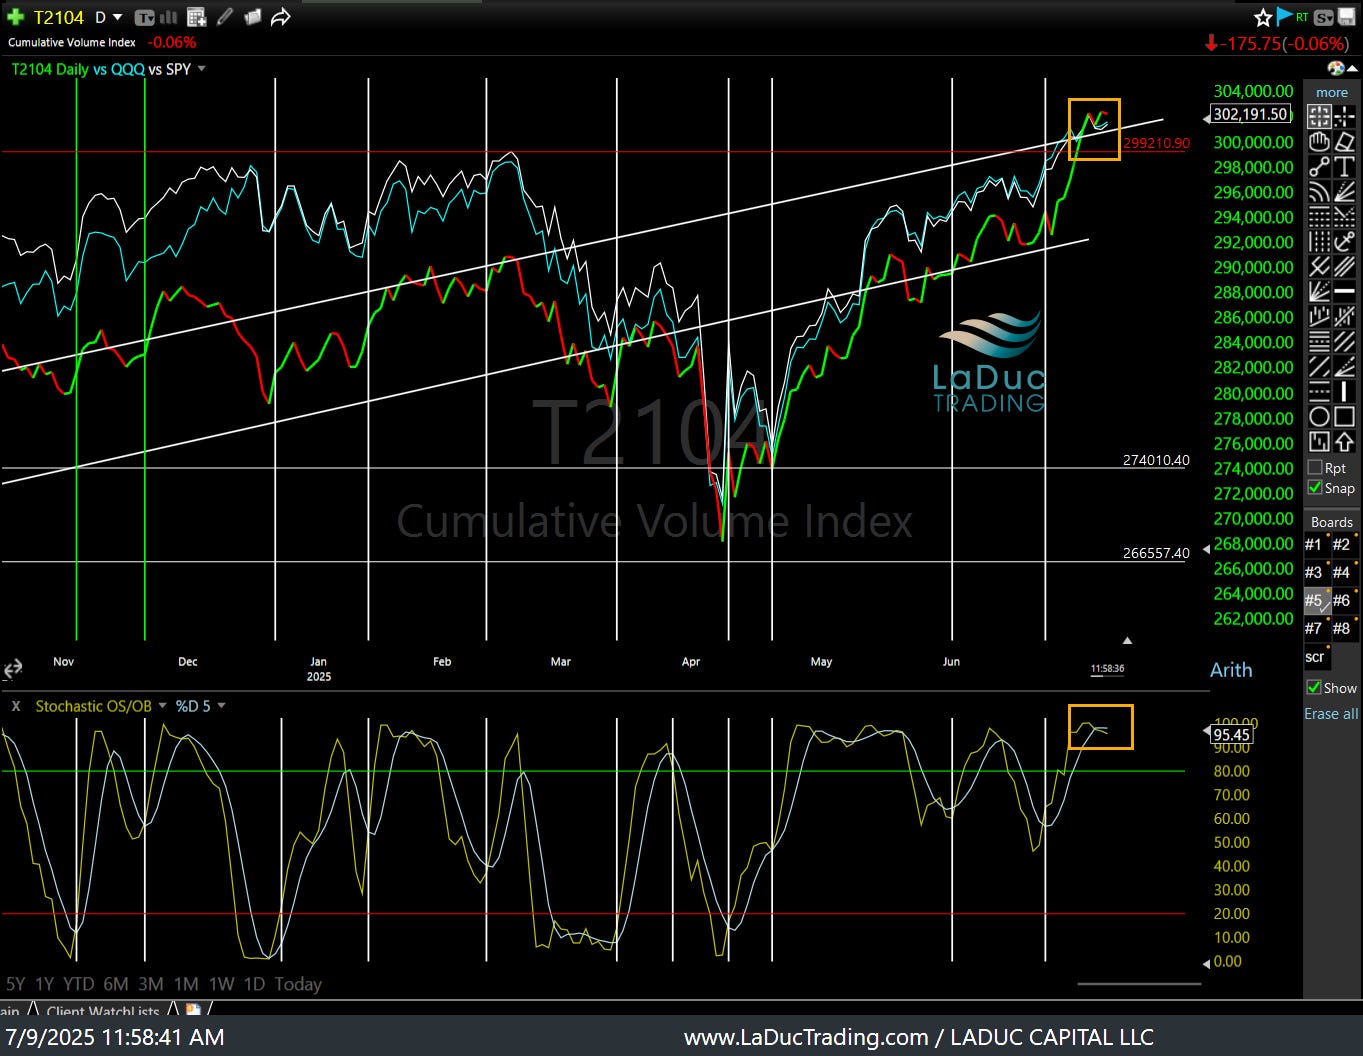
Cumulative Volume can easily tag its weekly 161.8 Fib retracement from the Feb-Apr downdraft before succumbing to rejection/digestion/selling. Should it get above, it will be a melt-up situation, so for market to stay healthy, it will go sideways in time & price.
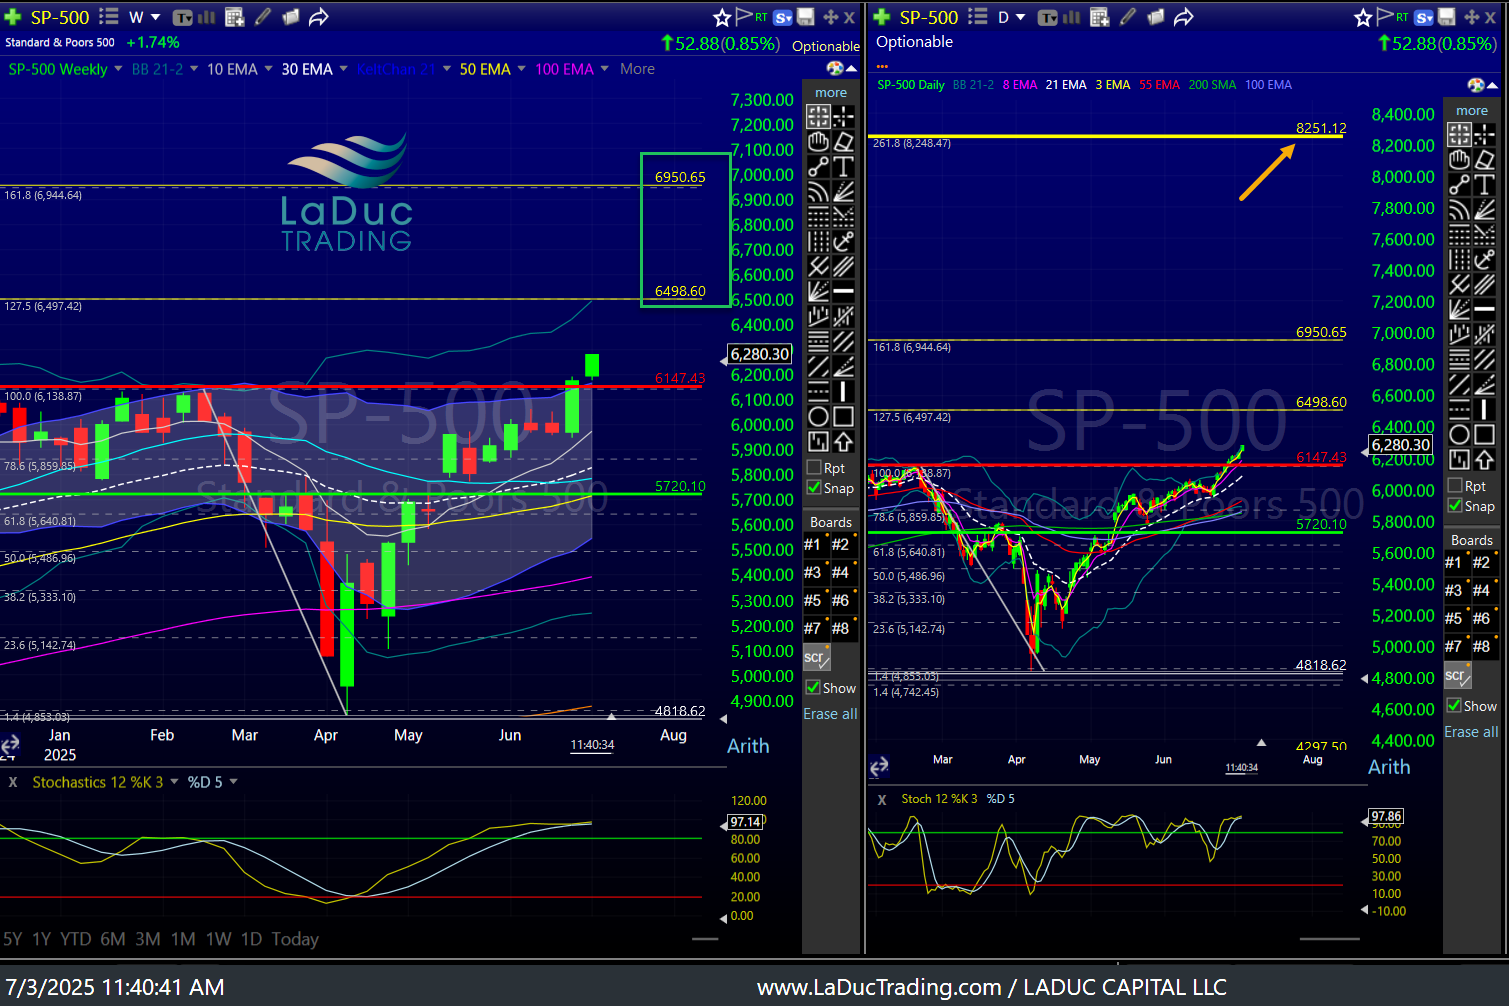
SPX can easily move into $6500 as long as 6147 wkly close holds; otherwise, it risks falling back into the channel with 5720 as short target. Big picture, SPX can continue to rise into $7000 even $8200 IN TIME.
In the intermediate term, all the key intermarket tells I show daily are still bid on a daily/weekly timeframe. Read: overbought can stay overbought.
But I know what to look for when it fails and I will let you know!!
Spirited show!! Oh my is Hans giddy with excitement about the possibilities of a parabolic melt-up! This is not his 1st rodeo! #1999
All-Time-Highs Can Turn Parabolic Macro-To-Micro Options Power Hour
Don’t forget to register for the next one!