
The MATH to the 80% of US GOVT DEBT that comes due NEXT YEAR!!

Here ya go!

Fed’s total Assets: $900B 2008 to $2.9T from 2009 to $4.5T 2014-18 plateau to $9.1T 2020 Covid ... where it sat before running off some to revert to 6.5T.
Fed’s Asset Breakdown (Early December 2025)
Total Assets: ~$6,536 billion ($6.5 trillion).
U.S. Treasuries: ~$4,189 billion ($4.2 trillion).
Mortgage-Backed Securities (MBS): ~$2,054 billion.
Other Securities: ~$293 billion
>Keep that 6.5T in mind as they can hold this for awhile (read: no rollover risk per se)
Federal Reserve Treasury Holdings by Maturity (Approx. late 2025)
Less than 1 year: \$486.965 billion (approx. \$0.49T)
1 to 5 Years: \$1.467 trillion (approx. \$1.47T)
5 to 10 Years: \$592.501 billion (approx. \$0.59T)
10+ Years: \$1.527 trillion (approx. \$1.53T)
Total Treasuries Held (Approx.): ~\$4.2 Trillion (as of Dec 2025)
Let’s move on...
T-Bill Financing (Last 12 Months: late 2024 - late 2025)
Percentage of New Debt: ~69-70% of all new U.S. government debt issued was T-Bills.
Total T-Bill Issuance: An estimated $25.4 trillion (record high).
Total Treasury Issuance: Roughly $36.6 trillion in total Treasury securities were issued.
Gundlach’s Doubleline has a great chart to help dissect where I’m going with this...
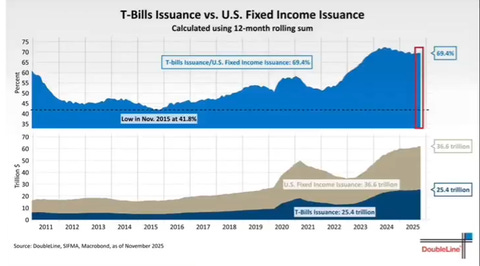
T-BILL ISSUANCE (vs Fixed Income Issuance) = 69.4%
Bottom chart: $25.4T of T-bills has been issued on US Debt.
Total US debt is now ~$38T but at the time of this chart just a few months ago it was $36.6T
Of the $36.6T in debt, we need to deduct ~$6T held on Fed BS.
(Remember, the Fed holds $6.5T of UST but only ~$500B needs to be rolled over next year)
So what percentage of our ever-growing debt over the past 12 months has been financed with Tbills?
Divide 24.5T into 30.6T and we get 80%.
Repeat: Over 80% of US GOVT DEBT comes due NEXT YEAR!!
Now, add a few trillion because the debt number is not falling; it’s rising.
Hope it helps.