November To Remember
Welcome back to the end of November. It was one to remember!
SPY with an 8% gain is one of the best in the last 100 years.
VIX has fallen to its lowest level in nearly 4 years!
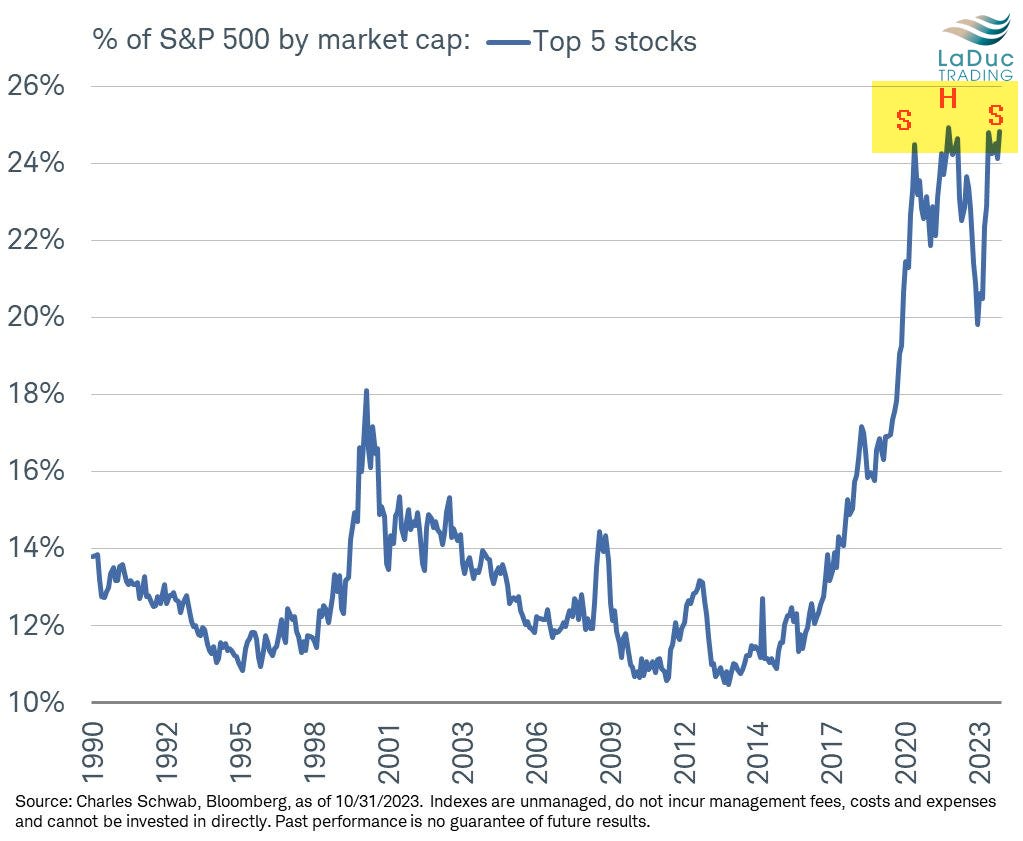
The Magnificent 7 saw a violent comeback (led by AAPL and MSFT), but it is the Top5 stocks that bear watching (see chart below) as they account for roughly 25% of the weighting and are forming a rather large Head & Shoulders pattern (2021 highs to present).
Bonds saw a relief rally off oversold levels with TLT rising 15% as 10Y fell back from 4.99% to 4.36%.
NYSE breadth also saw a relief rally which resulted in a relief rally in Russell 2000 on hopes of Fed rate cuts getting pulled forward as a result of Wall Street inflation metrics (CPI) cooling.
Labor market remains tight and yet is a most lagging indicator. My bet: we are approaching a major inflection point into end-of-year and especially Q1 where higher Jobless Claims will carry over to 4% Unemployment Rate which will trigger volatility
.
Calm Before The Storm?
SPX is now pricing in just a 2.4% move over the next month, nearly lowest in 5 years. That's a lot of sideways chop.
More likely, we have some burst of volatility, especially given:
A VIX of 12 is one standard deviation (8 points) below its long run average (20). While it can go 1 – 5 standard deviations above the mean during a crisis, the VIX seldom trades for less than 1 standard deviation. (Data Trek)
and
Upside convexity played out well. The "easy" part of the trade is gone.
Scott Rubner points out: CTAs are not short anymore...they are long $33bn of US equities having "printed" the largest buy over the past month, total almost $100bn.
Now there is actually downside convexity again in the SPX CTA estimates chart...via TheMarketEar
oh, and
Corporates buybacks, having bought back shares for around $100bn during the month of November, will soon enter the buyback blackout window on December 8, when the buying slowly decreases.
Putting all of this together (see chart below):
Cost of betting on a stock-market crash is cheapest since 2008
Cost of protecting against S&P drawdown in the next 12 months is at an all-time low.
Cost of puts is even cheaper today than in 2017 when VIX was at tis ALL-time low.
Unless this is 1999-esque - see chart!!
See Chase and Swing Summaries in their channels for specific tickers, but suffice it to say:
NYSE up to 16,000 resistance level ( no roll over yet, no break above yet)
MAG7 ratio same thing
Need a pick up in net sellers and red move in SVXY and/or bounce in USD +/or 10Y to get bears excited.
Until then, we chop sideways with lots of Chase and Swing and Trends long underneath working!
Market has remained choppy with the gap at 4575 SPX unfilled still!
Given net buying and breadth are staying supportive, it's hard to short market until that gap is filled.
On My “USD has likely peaked” Timing:
There have been questions about the timing.
First, a falling DXY has been bullish for stocks in the short term (see November results!).
My bet is that it would be bullish commodities (relatively) into the new year.
BUT, it's so bullish, it's bearish longer-term (as detailed under #macro-to-micro-support: https://laductrading.slack.com/archives/C01GND28N5B/p1699635602532329
On the 10Y yield moving higher next year (starting end of Q1/Q2 best bet), we have time still to put in base lower before moving higher.
And yes, the 10 year yield at 6.5% by EOY 2024 is both a bold prediction and high conviction.
Think of it as IF-THEN statement: 10Y must stay >4.1 weekly close on pullback, and once it gets back/stays above 4.9%, it will pick UP speed to 6.5%.
Here's an interview I did discussing this 2024 Prediction.
Did you enjoy #samanthas-market-thoughts posted above? Then you would love full access to her and her live trading room, detailed macro and intermarket analysis, not to mention full portfolio of trades across Chase, Swing and Trend timeframes!
Upgrade to CLUB or EDGE today!


