Not A Good Look
My morning thoughts posted by Mikey under #trading-room-notes at 11:30ET
Risk off is still the play - while waiting for signs of stabilization in bonds before committing to a bounce. USD firm only means it can continue into 104 area as continued headwind. 10Y tags 4.3%: Above is bearish and below is market bullish. VIX is still poised and not coming down to fill its daily gap at 14.30 while SVXY has not broken below key wkly support 82.33 but it is not a healthy chart. VIX closing > 16 on wkly is bullish into next week with 200D as PT at 18.80. As long as my internal indicators still show breadth breaking down and net selling picking up... no bounce. We had very large internal destruction yday morning BEFORE markets broke down. I see no change, yet.
It's a waiting game for chase/swing longs as summer trading volume has dried up with macro headwinds of China's economic slowdown prompting President Xi to force banks to conduct yuan intervention to backstop their stock market and stem capital flows. Will they surprise with a devaluation event like they did in 2015? VIX spiked 400% (10.88 to 58+) back then and in today's highly leveraged VOL selling environment, a trigger like that would be equity deflating in a big way and in a hurry. I'm not suggesting that. I'm warning that it is an outlier event worth considering and why I have been tracking Asian FX risk so closely with US treasury selling as reason for higher yields which can/are causing equities to be repriced. Should China stabilize, US equities and bonds should catch a bid, but I still believe it will be sold at their respective 21D resistance levels.
For now, we are firmly below with most key indices below their 55D/10W and in some cases sitting on 100W! Clearly, we have a solid two-way market now. Liquidity is waning and as such derivatives are much less bullish. Many wait for NVDA to save bulls next week when they announce earnings. I have my sincere doubts. Or as I warned with AAPL, it was a much higher probability of a 'buy the rumor, sell the news'. That was exactly what happened on Aug 3rd - helped by the breadth destruction and net selling that had already turned south on Aug 1st.
Tomorrow is OpEx so positions need to be dealt with today before the monthly options chains expire in the morning. The largest strike of course is at SPX 4400 but I see SPY 438 of size so that's where I see a lottery bet. As for QQQ, we are already at my 360.66 PT where I expected a bounce. If not, next up is 355 - my strong bet in time since NYFANG went into distribution August 2nd with a gap down.
On Bonds:
And here we are near end of day and yields keep rising pressuring equities.
Even big picture, I have been a big interest rate bull DESPITE talk of Fed slowing/pausing/cutting.
So many macro wonks recommending bonds here. Cullen Roche will a very thoughtful question:
But the crucial question today is “how much upside is there in interest rates” given that the Fed appears closer to their stopping point?
My Answer:
The increasing debt issuance needs (sellers) versus the decreasing pool of debt owners (buyers) creates higher yields over time such at same time putting devaluation pressures on USD over time.
I can't say it any other way than this:
Me, August 2020: "Bonds are done going up."
Now?
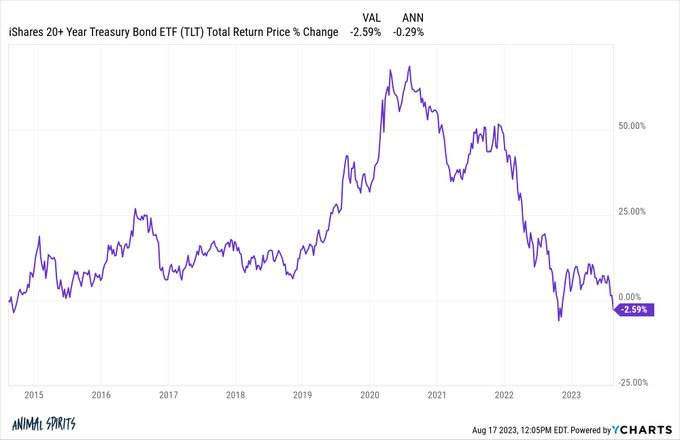
Ben Carlson reminds that long-term US government bonds (TLT) now has a negative total return going back 9 years (obviously even worse w/inflation). See chart below.
Even more shocking (for some):
“The 10-Year Treasury Bond is now down 1% in 2023, on pace for its third consecutive negative year. With data going back to 1928, that's never happened before.”
@charliebilello
On Equities:
So my warning August 1st: "Rising Yields Equal Risk Off"
"Market is Priced to Perfection", turned
"Time to Protect", and this week:
"Bond Bulls Need to Defend Here!"
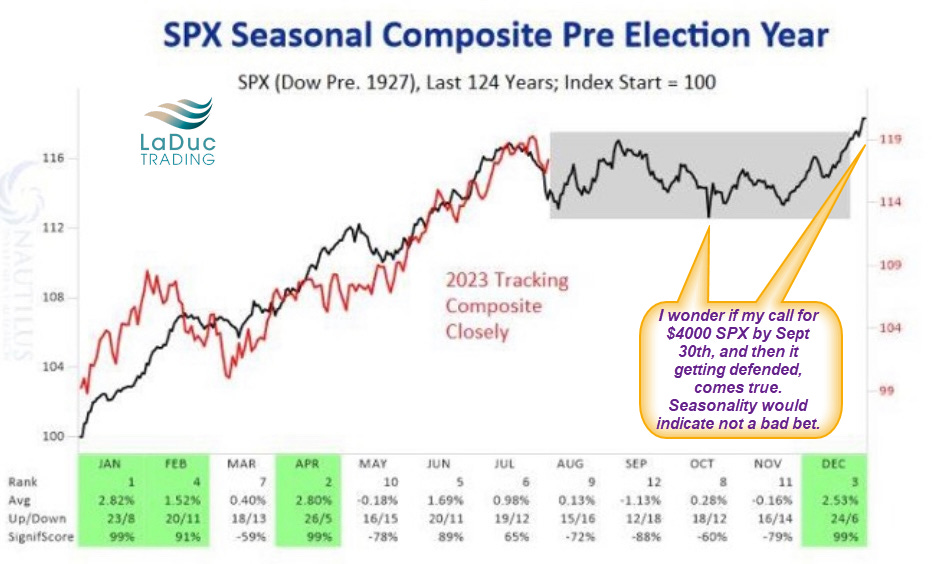
I just found a great chart that supports my call for SPX 4000 by end of quarter - a call I made several weeks ago BEFORE we turned.
The S&P 500 is curiously following historical seasonality trends for pre-election years very closely. The historical path suggests more market consolidation and chop into November before a year end rally.
With that, I wonder if my call for $4000 SPX by Sept 30th - which I've been talking about since July - that I also said likely gets strongly defended, comes true.
Seasonality would indicate it's not such a bad bet.
Craig reminds #macro-advisor-craig that there will be significant liquidity drain in the month of September to support my thesis.
For now, the market pulling back WITH oil AND gold AND bonds has been timed well.
My intermarket analysis warned it was peaking AND rolling over AND not done.
On Credit Spreads:
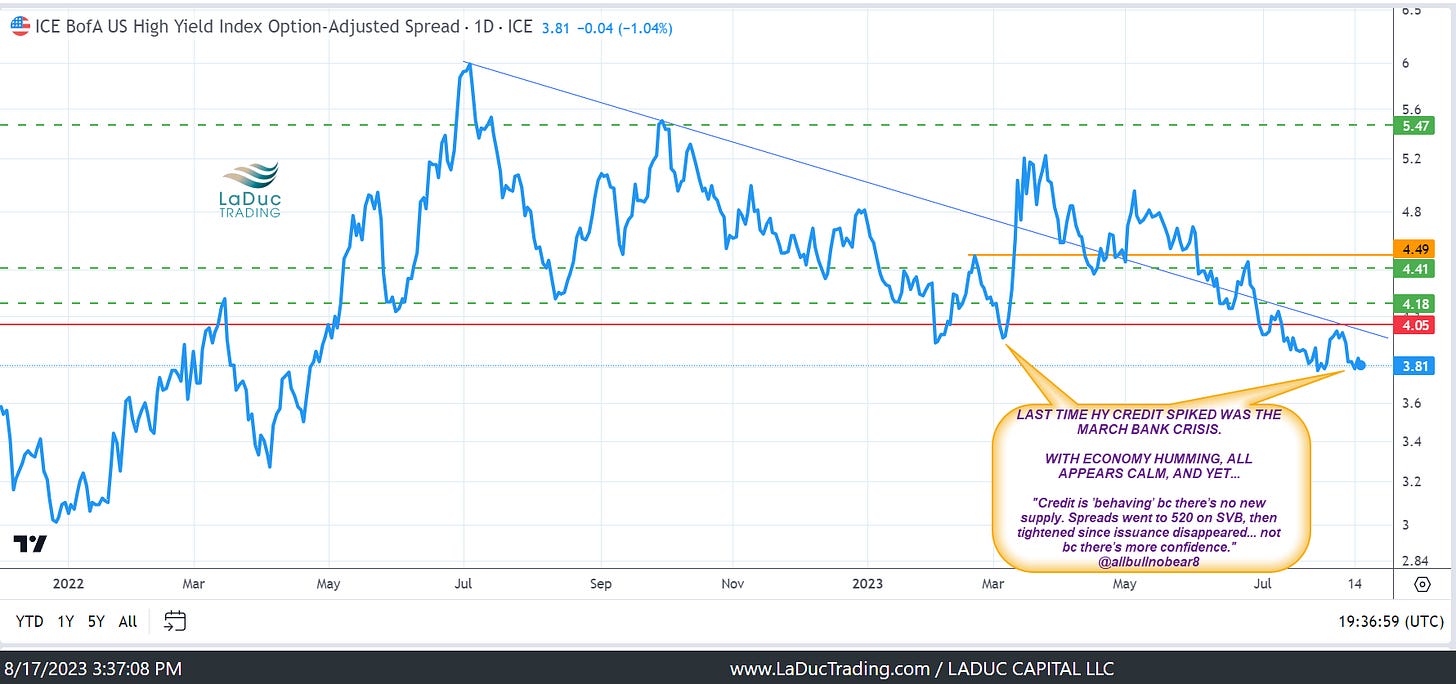
The only thing that hasn't triggered to confirm a true panic: credit spreads. See chart...
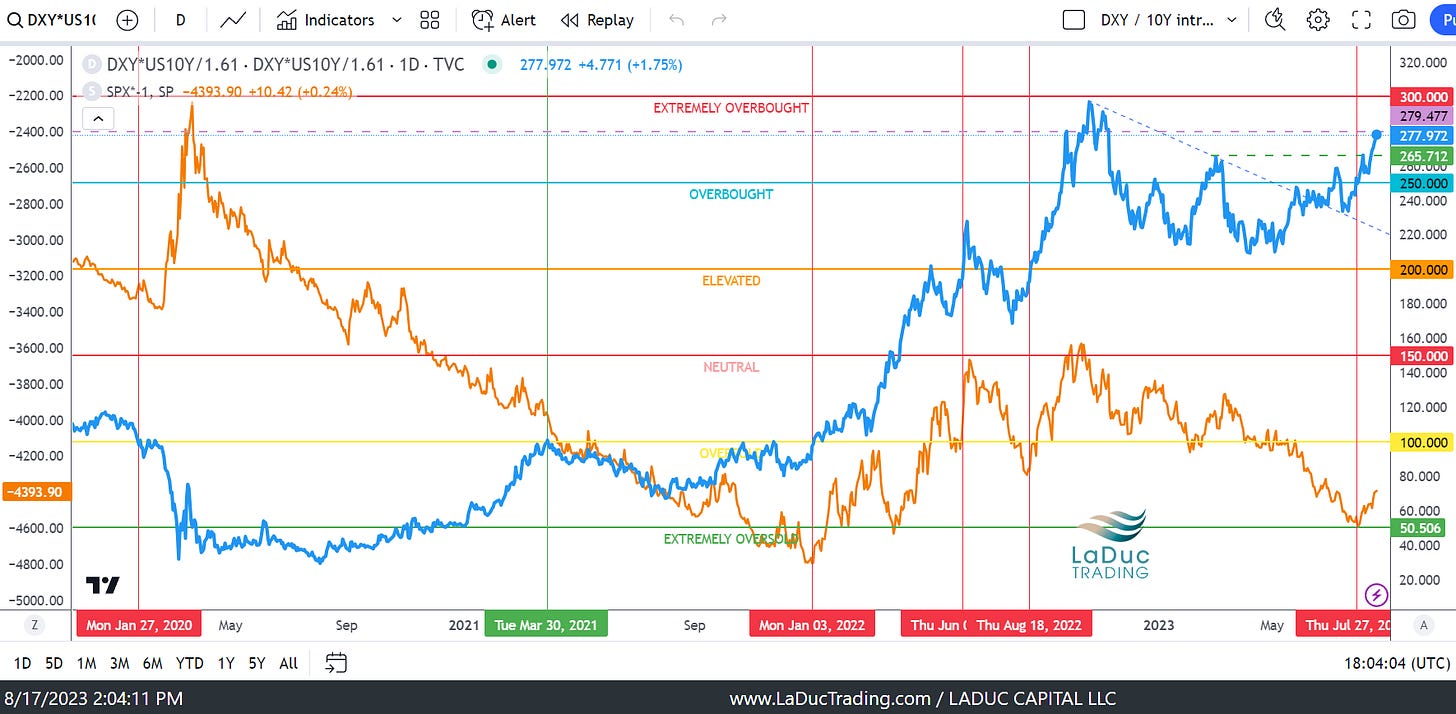
New Intermarket Tell for RISK ON/OFF: Last but not least, I created a new Intermarket Tell - that triggered July 27th for risk off once the blue indicator crosses above a key value threshhold.
Really cool to backtest and see EVERYTHING changed JAN 03 2022.
And right now, once it got above July 27th 2023 timeframe, WE HAVE HAD SOLID RISK OFF in this indicator, even if the market is just noticing this week.
It wasn't AAPL. We triggered before that!
And it's still quite elevated as VIX can attest.
Did you enjoy #samanthas-market-thoughts posted above? Then you would love full access to her and her live trading room, detailed macro and intermarket analysis, not to mention full portfolio of trades across Chase, Swing and Trend timeframes!
Upgrade to CLUB or EDGE today!


