
MINI GROWTH SCARE CAN TURN MAJOR GROWTH RISK

More Market Chop Until At Least FOMC Sept 17th
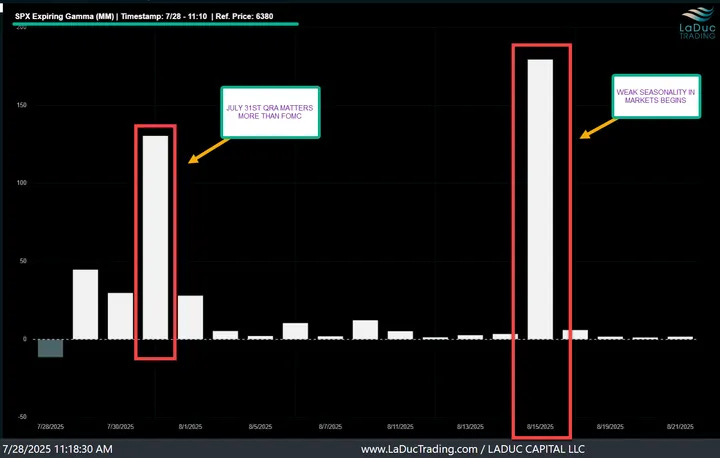
I warned clients before the coming shake-n-bake market weakness with JULY 31st options expiration, and with (same client post) note to buy the dip before more weakness AUG 15th options expiration into Aug 20th VIX expiry: SHORT THEN LONG - HERE'S WHERE & WHY. Yup, that worked well.

Then last week I gave well-timed warnings for post-NVDA earnings sell-off into $172, which hit - we were LIVE. Then I reminded it will go there again during RTH (regular trading hours) - likely by NFP (non-farm payroll) which is this Friday Sept 5th. I specifically gave $169 NVDA and $559 short for $QQQ. BOTH HIT TODAY!!
Afterhours, positive news for GOOGL’s anti-trust case is helping QQQ to bounce back into its gap down level: 568.64. But even then, the Head & Shoulders formation I could see forming on NVDA and QQQ last few weeks has now taken shape - and everyone sees it … now ;-).
Keep it simple: when/if NVDA gets/stays back > $173 wkly gap down, it is bullish; below it is $152 as noted/expected next few weeks. It is a simple ‘retracement to mean’ trade I saw playing out for so many overbought tech/semi darlings - but especially NVDA. I had already called the retracement in MSFT post earnings from 555 to 500 and in ORCL from 250 to 218.
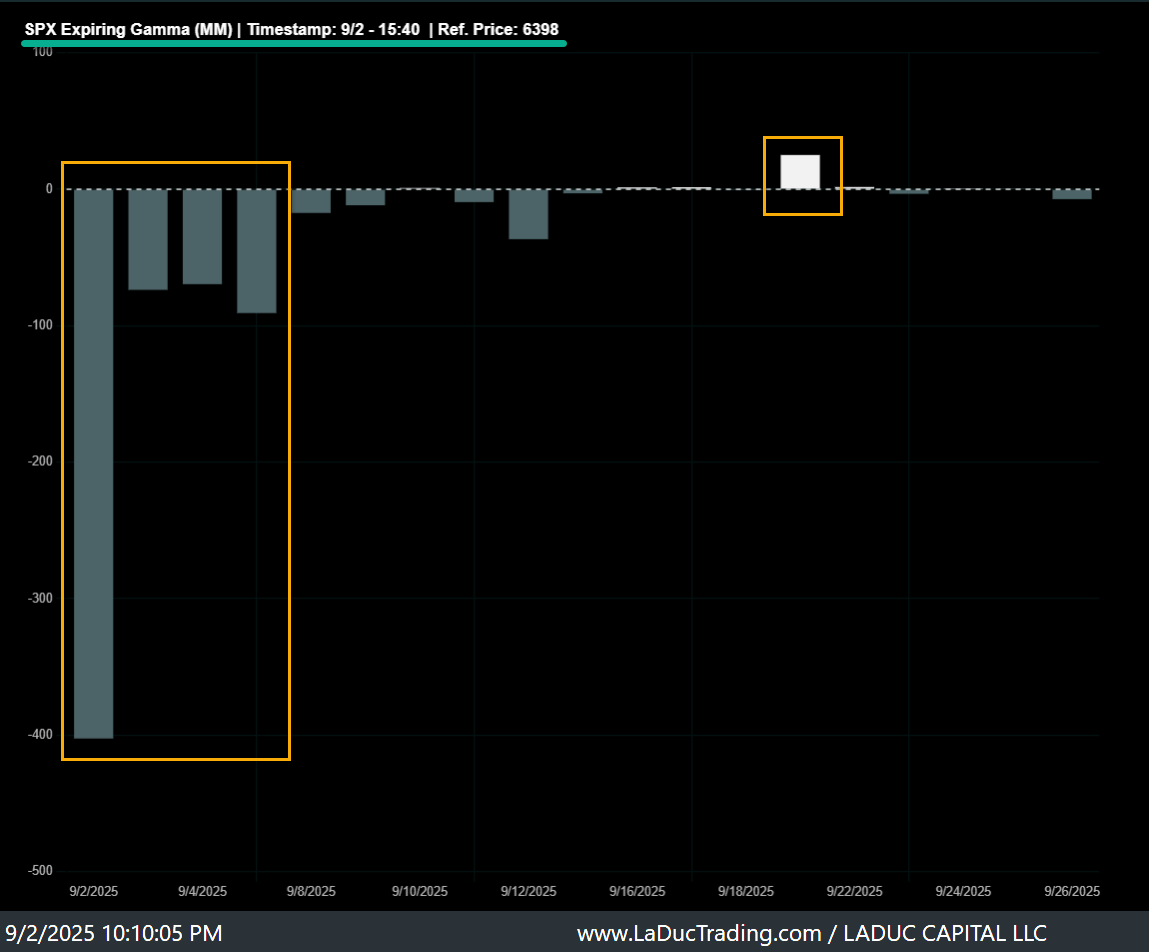
Given all the SPX gamma of size being taken off the board in July/Aug, and now SPX expiring gamma is negative… I can see more chop until FOMC Sept 17th at the earliest.
Before diggin in to my Most Bearish Charts that highlight:
Yield Curve Steepener Risk
Job Growth Revision Risk
Growth Scare Risk
Let’s talk about one of the most bullish reasons market can melt up into year-end:
